HP INC.: ANALYSTS ARE POSITIVE DESPITE THE ONGOING STOCK SELL-OFF

| Scenario | |
|---|---|
| Timeframe | Weekly |
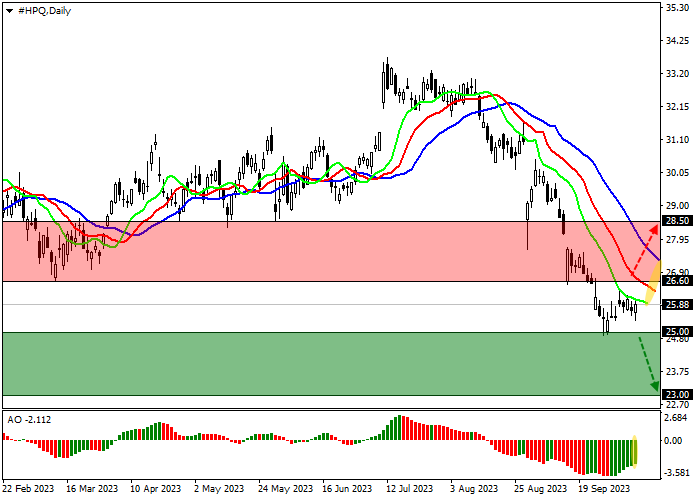
| Recommendation | SELL STOP |
| Entry Point | 24.95 |
| Take Profit | 23.00 |
| Stop Loss | 26.00 |
| Key Levels | 23.00, 25.00, 26.60, 28.50 |
| Alternative scenario | |
|---|---|
| Recommendation | BUY STOP |
| Entry Point | 26.65 |
| Take Profit | 28.50 |
| Stop Loss | 26.00 |
| Key Levels | 23.00, 25.00, 26.60, 28.50 |
Current trend
The securities of the American IT company HP Inc. continue to move in a corrective trend and are at around 25.90 dollar per share.
After a noticeable drop in the instrument, which has already reached 25%, its attractiveness for new positions has increased: Bank of America analysts have twice raised the company's rating from "sell" to "buy", and also raised the target price by USD 8 at once, to USD 33 per share. It is expected that the negative factors associated with the sell-off of HP Inc. shares, which was caused by reports of their sale by Warren Buffett's Berkshire Hathaway investment fund, have ceased to exert pressure on the price. Sales reached $130 million (just over 4.8 million shares), reducing the investment fund's stake in HP Inc. from 11.7% to 11.2%.
The company will publish a new report on November 21, and now the revenue forecast is 13.85 billion dollar, which is higher than 13.2 billion a quarter earlier. The forecast for earnings per share assumes 0.9044 dollar, which is also higher than 0.86 earlier.
Support and resistance
On the D1 chart, the shares continue to trade around the minimum of the year at around 25.00 and are preparing to overcome it.
Technical indicators continue to show a stable sell signal: fast EMAS of the Alligator indicator are below the signal line, and AO histogram is in the sales zone, forming new correction bars.
Support levels: 25.00, 23.00.
Resistance levels: 26.60, 28.50.

Trading tips
If the asset continues to decline, as well as the price consolidates below the local support level, at around 25.00, one may open short positions with the target at 23.00 and stop-loss at 26.00. Implementation time: 7 days and more.
If the asset continues to grow and consolidates above the local resistance level, at 26.60, long positions may be opened with the target at 28.50 and stop-loss at 26.00.
Disclaimer: The content above represents only the views of the author or guest. It does not represent any views or positions of FOLLOWME and does not mean that FOLLOWME agrees with its statement or description, nor does it constitute any investment advice. For all actions taken by visitors based on information provided by the FOLLOWME community, the community does not assume any form of liability unless otherwise expressly promised in writing.
FOLLOWME Trading Community Website: https://www.followme.com


Hot
No comment on record. Start new comment.