RTX CORP.: TECHNICAL ANALYSIS


| Scenario | |
|---|---|
| Timeframe | Weekly |
| Recommendation | SELL STOP |
| Entry Point | 67.95 |
| Take Profit | 56.00 |
| Stop Loss | 71.00 |
| Key Levels | 56.00, 68.00, 71.00, 77.00 |
| Alternative scenario | |
|---|---|
| Recommendation | BUY STOP |
| Entry Point | 71.05 |
| Take Profit | 77.00 |
| Stop Loss | 69.00 |
| Key Levels | 56.00, 68.00, 71.00, 77.00 |
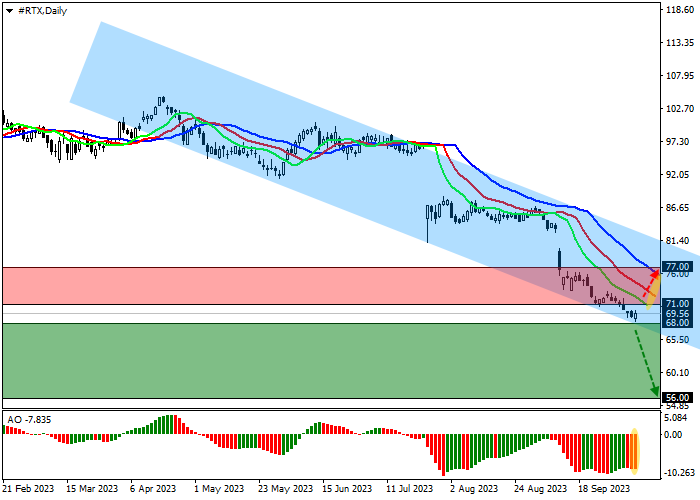
Shares of RTX Corp., an American aerospace and defense conglomerate, are moving within a corrective trend near the level of 70.00.
On the daily chart, the price is actively declining along the support line of a wide downward channel 81.00–65.50, having already lost more than 30.5% since mid-July.
On the four-hour chart, the quotes have overcome the next low of 71.00 and continued their downward dynamics, for which there are practically no obstacles, and the global target is the historical low of December 25, 2020, around 56.00.
Technical indicators are strengthening the sell signal: fast EMAs on the Alligator indicator are moving away from the signal line, and the AO histogram is forming downward bars in the sell zone.
Trading tips
Short positions may be opened after the price declines and consolidates below 68.00 with the target at 56.00. Stop loss – 71.00. Implementation period: 7 days or more.
Long positions may be opened after a reversal, growth, and consolidation of the price above 71.00 with the target at 77.00. Stop loss – 69.00.
Disclaimer: The content above represents only the views of the author or guest. It does not represent any views or positions of FOLLOWME and does not mean that FOLLOWME agrees with its statement or description, nor does it constitute any investment advice. For all actions taken by visitors based on information provided by the FOLLOWME community, the community does not assume any form of liability unless otherwise expressly promised in writing.
FOLLOWME Trading Community Website: https://www.followme.com


Hot
No comment on record. Start new comment.