AUD/USD: THE QUOTES REMAIN WITHIN A SIDEWAYS RANGE

| Scenario | |
|---|---|
| Timeframe | Weekly |
| Recommendation | SELL STOP |
| Entry Point | 0.6345 |
| Take Profit | 0.6286, 0.6225 |
| Stop Loss | 0.6385 |
| Key Levels | 0.6225, 0.6286, 0.6347, 0.6408, 0.6500, 0.6591, 0.6652 |
| Alternative scenario | |
|---|---|
| Recommendation | BUY STOP |
| Entry Point | 0.6500 |
| Take Profit | 0.6591, 0.6652 |
| Stop Loss | 0.6450 |
| Key Levels | 0.6225, 0.6286, 0.6347, 0.6408, 0.6500, 0.6591, 0.6652 |
Current trend
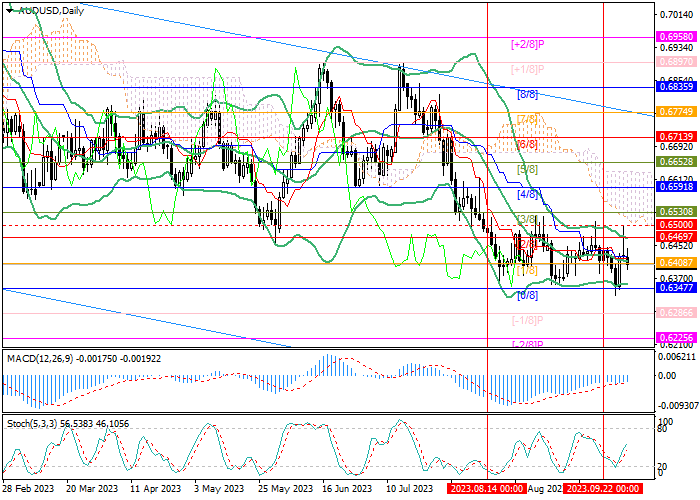
The AUD/USD pair has been trading within a sideways range of 0.6500–0.6347 for a month and a half and cannot leave it yet.
Last week, the dynamics of the asset were ambiguous: the quotes tested the lower limit of the range but then rose sharply to the upper limit against the publication of US inflationary data: the core personal consumption expenditures index, which US Fed’s officials rely on when determining further monetary policy, decreased from 0.2% to 0.1% MoM and from 4.3% to 3.9% YoY. The statistics raise the possibility that the regulator will refuse another interest rate increase this year due to a serious slowdown in consumer price growth but even so, borrowing costs will remain high for a long time.
Today, the negative trend resumed amid the publication of poor macroeconomic data from Australia, as well as the resolution of the government funding crisis in the United States. Manufacturing PMI adjusted from 49.6 points to 48.7 points, although not as significantly as experts expected (48.2 points). However, the industry slowdown continues for the seventh month, increasing the risk of a deepening downturn in the national economy. The US currency is receiving support from the government’s funding extension, agreed over the weekend, which will allow the economy to function fully for another 45 days.
Support and resistance
The trading instrument is trying to break below 0.6408 (Murrey level [1/8]), the middle line of Bollinger Bands, to continue its decline to the area of 0.6347 (Murrey level [0/8]), 0.6286 (Murrey level [–1/8]), 0.6225 (Murrey level [–2/8]). The key “bullish” level is 0.6500, a breakout of which will allow the quotes to reach the area of 0.6591 (Murrey level [4/8]) and 0.6652 (Murrey level [5/8]).
Technical indicators do not give a single signal: Bollinger Bands are horizontal, MACD histogram is stable in the negative zone, and Stochastic is directed upwards.
Resistance levels: 0.6500, 0.6591, 0.6652.
Support levels: 0.6408, 0.6347, 0.6286, 0.6225.

Trading tips
Short positions may be opened below 0.6347 with the targets at 0.6286, 0.6225 and stop loss around 0.6385. Implementation time: 5–7 days.
Long positions may be opened above 0.6500 with the targets at 0.6591, 0.6652 and stop loss around 0.6450.
Disclaimer: The content above represents only the views of the author or guest. It does not represent any views or positions of FOLLOWME and does not mean that FOLLOWME agrees with its statement or description, nor does it constitute any investment advice. For all actions taken by visitors based on information provided by the FOLLOWME community, the community does not assume any form of liability unless otherwise expressly promised in writing.
FOLLOWME Trading Community Website: https://www.followme.com


Hot
No comment on record. Start new comment.