AUD/USD: RENEWED INFLATION PRESSURES THE AUSTRALIAN CURRENCY


| Scenario | |
|---|---|
| Timeframe | Weekly |
| Recommendation | SELL STOP |
| Entry Point | 0.6345 |
| Take Profit | 0.6286, 0.6225 |
| Stop Loss | 0.6395 |
| Key Levels | 0.6225, 0.6286, 0.6347, 0.6469, 0.6591, 0.6652 |
| Alternative scenario | |
|---|---|
| Recommendation | BUY STOP |
| Entry Point | 0.6470 |
| Take Profit | 0.6591, 0.6652 |
| Stop Loss | 0.6430 |
| Key Levels | 0.6225, 0.6286, 0.6347, 0.6469, 0.6591, 0.6652 |
Current trend
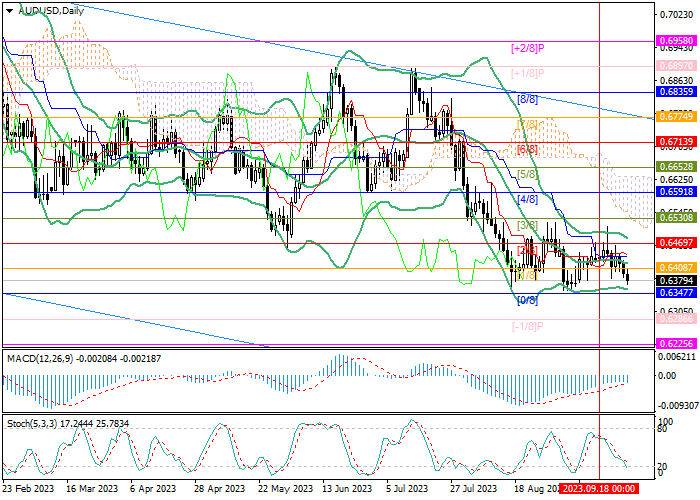
The AUD/USD pair continues to decline and is currently trading around 0.6380.
The Australian dollar came under pressure after the publication of August inflation data: the consumer price index rose from 4.9% to 5.2% YoY amid growing oil and energy prices, which creates significant uncertainty in the further actions of the Reserve Bank of Australia (RBA). Officials have kept the interest rate at 4.10% for four consecutive months, fearing to create unnecessary pressure on the economy and hoping that the current level of borrowing costs will be enough to sustainably slow price growth to 2.0-3.0%. The published data could cause the rate to rise again in October, creating even greater problems for households that have already been forced to significantly reduce their spending.
Against this background, the US currency looks more attractive for investment. US Federal Reserve officials are also set for another interest rate increase before the end of the year, but overall the American economy is more successful in resisting the current crisis than the Australian one.
Support and resistance
The AUD/USD pair is close to 0.6347 mark (Murrey level [0/8]), a breakdown of which will give the prospect of a decline to 0.6286 (Murrey level [–1/8]) and 0.6225 (Murrey level [–2/8]). The key level for the “bulls” seems to be 0.6469 (Murrey level [2/8]); if the price is consolidated above it, one can expect renewed growth to 0.6591 (Murrey level [4/8]) and 0.6652 (Murrey level [5/8]).
Technical indicators generally show a continued decline: Bollinger Bands are horizontal, MACD is stable in the negative zone, and Stochastic is directed downward.
Resistance levels: 0.6469, 0.6591, 0.6652.
Support levels: 0.6347, 0.6286, 0.6225.
Trading tips
Short positions can be opened below 0.6347 with targets at 0.6286, 0.6225 and stop loss at 0.6395. Implementation period: 5-7 days.
Long positions can be opened above 0.6469 with targets at 0.6591, 0.6652 and stop loss at 0.6430.
Disclaimer: The content above represents only the views of the author or guest. It does not represent any views or positions of FOLLOWME and does not mean that FOLLOWME agrees with its statement or description, nor does it constitute any investment advice. For all actions taken by visitors based on information provided by the FOLLOWME community, the community does not assume any form of liability unless otherwise expressly promised in writing.
FOLLOWME Trading Community Website: https://www.followme.com


Hot
No comment on record. Start new comment.