USD/CHF: THE INSTRUMENT IS RECOVERING FROM "BEARISH" DYNAMICS

Scenario Timeframe Intraday Recommendation SELL STOP Entry Point 0.8900 Take Profit 0.8800 Stop Loss 0.8950 Key Levels 0.8826, 0.8850, 0.8875, 0.8900, 0.8950, 0.9000, 0.9036, 0.9100
Alternative scenario Recommendation BUY STOP Entry Point 0.8950 Take Profit 0.9036 Stop Loss 0.8900 Key Levels 0.8826, 0.8850, 0.8875, 0.8900, 0.8950, 0.9000, 0.9036, 0.9100
Current trend
The USD/CHF pair is showing weak growth, recovering from Monday's mostly "bearish" dynamics. The instrument is testing 0.8915 for a breakout, but activity in the market remains low.
The US dollar remains under pressure as investors prefer to wait for the release of US inflation statistics on Wednesday. Markets expect to record a rise in consumer prices from 0.2% to 0.6%, which will be another signal in favor of a possible interest rate hike by the US Federal Reserve later this year. In addition, on Thursday, data will be presented on Producer Price Indices, as well as on Retail Sales volumes for August, forecasts for which suggest a sharp slowdown in the indicator from 0.7% to 0.2%.
In turn, August statistics on producer and import price indices will be published in Switzerland on Thursday, recording changes in the price level for goods, components and raw materials on the wholesale market. In the previous month, producer inflation slowed by 0.1% on a monthly basis and 0.6% on an annual basis.
Support and resistance
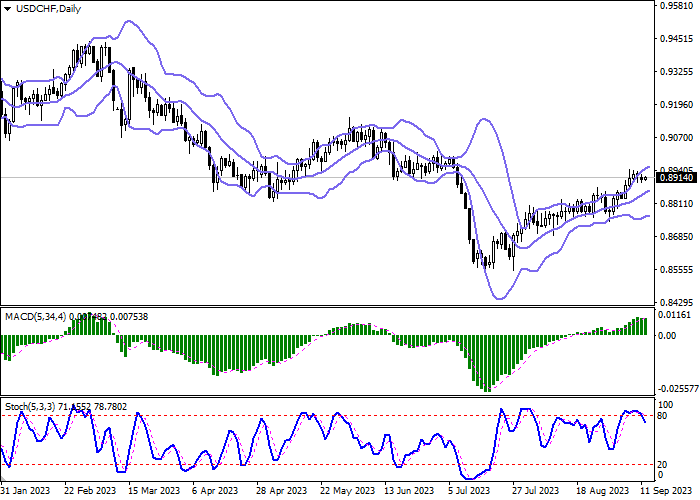
Bollinger Bands in D1 chart show moderate growth. The price range expands from above, freeing a path to new local highs for the "bulls". MACD is reversing downwards trying to form a new sell signal (trying to consolidate below the signal line). Stochastic shows similar dynamics, leaving the overbought area with a fairly strong sell signal. The indicator readings signal in favor of the development of a "bearish" correction in the near future.
Resistance levels: 0.8950, 0.9000, 0.9036, 0.9100.
Support levels: 0.8900, 0.8875, 0.8850, 0.8826.


Trading tips
Short positions may be opened after a breakdown of 0.8900 with the target at 0.8800. Stop-loss — 0.8950. Implementation time: 2-3 days.
A rebound from 0.8900 as from support followed by a breakout of 0.8950 may become a signal for opening new long positions with the target at 0.9036. Stop-loss — 0.8900.
| Scenario | |
|---|---|
| Timeframe | Intraday |
| Recommendation | SELL STOP |
| Entry Point | 0.8900 |
| Take Profit | 0.8800 |
| Stop Loss | 0.8950 |
| Key Levels | 0.8826, 0.8850, 0.8875, 0.8900, 0.8950, 0.9000, 0.9036, 0.9100 |
| Alternative scenario | |
|---|---|
| Recommendation | BUY STOP |
| Entry Point | 0.8950 |
| Take Profit | 0.9036 |
| Stop Loss | 0.8900 |
| Key Levels | 0.8826, 0.8850, 0.8875, 0.8900, 0.8950, 0.9000, 0.9036, 0.9100 |
Current trend
The USD/CHF pair is showing weak growth, recovering from Monday's mostly "bearish" dynamics. The instrument is testing 0.8915 for a breakout, but activity in the market remains low.
The US dollar remains under pressure as investors prefer to wait for the release of US inflation statistics on Wednesday. Markets expect to record a rise in consumer prices from 0.2% to 0.6%, which will be another signal in favor of a possible interest rate hike by the US Federal Reserve later this year. In addition, on Thursday, data will be presented on Producer Price Indices, as well as on Retail Sales volumes for August, forecasts for which suggest a sharp slowdown in the indicator from 0.7% to 0.2%.
In turn, August statistics on producer and import price indices will be published in Switzerland on Thursday, recording changes in the price level for goods, components and raw materials on the wholesale market. In the previous month, producer inflation slowed by 0.1% on a monthly basis and 0.6% on an annual basis.
Support and resistance
Bollinger Bands in D1 chart show moderate growth. The price range expands from above, freeing a path to new local highs for the "bulls". MACD is reversing downwards trying to form a new sell signal (trying to consolidate below the signal line). Stochastic shows similar dynamics, leaving the overbought area with a fairly strong sell signal. The indicator readings signal in favor of the development of a "bearish" correction in the near future.
Resistance levels: 0.8950, 0.9000, 0.9036, 0.9100.
Support levels: 0.8900, 0.8875, 0.8850, 0.8826.
Trading tips
Short positions may be opened after a breakdown of 0.8900 with the target at 0.8800. Stop-loss — 0.8950. Implementation time: 2-3 days.
A rebound from 0.8900 as from support followed by a breakout of 0.8950 may become a signal for opening new long positions with the target at 0.9036. Stop-loss — 0.8900.
Disclaimer: The content above represents only the views of the author or guest. It does not represent any views or positions of FOLLOWME and does not mean that FOLLOWME agrees with its statement or description, nor does it constitute any investment advice. For all actions taken by visitors based on information provided by the FOLLOWME community, the community does not assume any form of liability unless otherwise expressly promised in writing.
FOLLOWME Trading Community Website: https://www.followme.com


Hot
No comment on record. Start new comment.