USD/CAD: THE AMERICAN DOLLAR DEVELOPS A STRONG “BEARISH” MOMENTUM


Scenario Timeframe Intraday Recommendation SELL Entry Point 1.3590 Take Profit 1.3500 Stop Loss 1.3650 Key Levels 1.3450, 1.3500, 1.3550, 1.3600, 1.3650, 1.3700, 1.3750, 1.3800
Alternative scenario Recommendation BUY STOP Entry Point 1.3650 Take Profit 1.3750 Stop Loss 1.3600 Key Levels 1.3450, 1.3500, 1.3550, 1.3600, 1.3650, 1.3700, 1.3750, 1.3800
Current trend
During the Asian session, the USD/CAD pair is actively declining, developing the strong “bearish” impulse formed on Friday.
Investors are expecting further actions of the US Federal Reserve: the regulator is not expected to increase the interest rate during the September meeting but tightening monetary policy by the end of the year is still possible. Inflation statistics for August are in focus, with forecasts of growth from 0.2% to 0.5% MoM, while the annual rate is expected to remain close to 3.2% YoY.
The Canadian dollar is supported by strong August labor market data published on Friday: employment increased by 39.9K after a contraction of 6.4K last month, although experts expected an increase of only 15.0K. Average hourly wages adjusted from 5.0% to 5.2%, and the unemployment rate remained at 5.5%, contrary to forecasts of growth to 5.6%.
Support and resistance
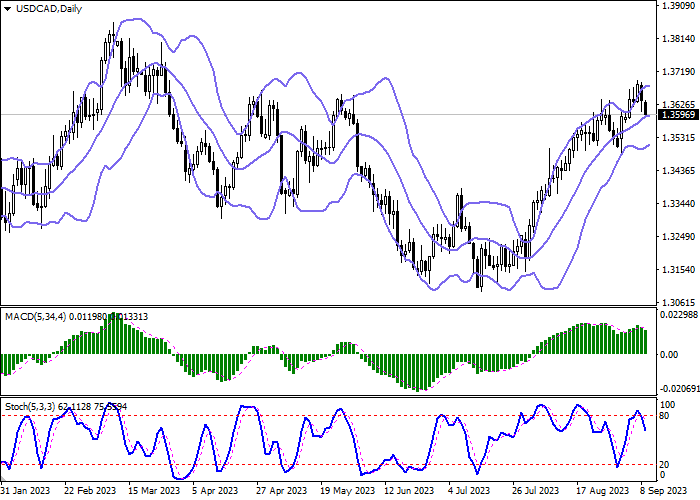
On the daily chart, Bollinger Bands are trying to reverse horizontally: the price range is narrowing from below, reflecting the emergence of ambiguous trading dynamics in the short term. The MACD indicator reversed downwards, forming a new sell signal (the histogram is below the signal line). Stochastic is retreating from its highs, which signaled that the US dollar might become overbought in the ultra-short term.
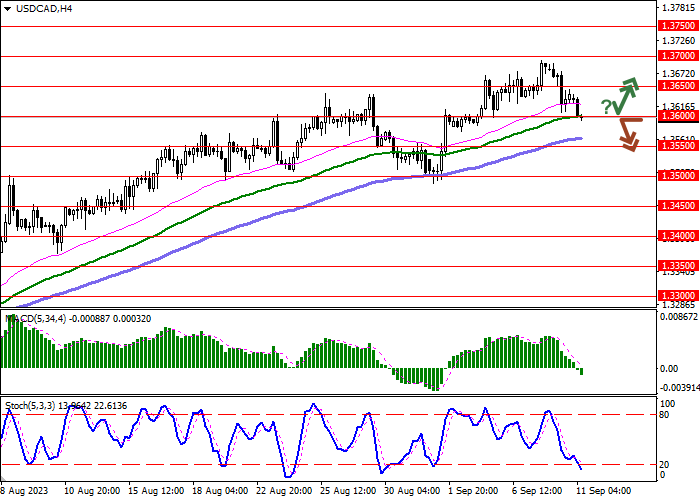
Resistance levels: 1.3650, 1.3700, 1.3750, 1.3800.
Support levels: 1.3600, 1.3550, 1.3500, 1.3450.
Trading tips
Short positions may be opened after a breakdown of 1.3600 with the target at 1.3500. Stop loss – 1.3650. Implementation time: 2–3 days.
Long positions may be opened after a rebound from 1.3600 and a breakout of 1.3650 with
| Scenario | |
|---|---|
| Timeframe | Intraday |
| Recommendation | SELL |
| Entry Point | 1.3590 |
| Take Profit | 1.3500 |
| Stop Loss | 1.3650 |
| Key Levels | 1.3450, 1.3500, 1.3550, 1.3600, 1.3650, 1.3700, 1.3750, 1.3800 |
| Alternative scenario | |
|---|---|
| Recommendation | BUY STOP |
| Entry Point | 1.3650 |
| Take Profit | 1.3750 |
| Stop Loss | 1.3600 |
| Key Levels | 1.3450, 1.3500, 1.3550, 1.3600, 1.3650, 1.3700, 1.3750, 1.3800 |
Current trend
During the Asian session, the USD/CAD pair is actively declining, developing the strong “bearish” impulse formed on Friday.
Investors are expecting further actions of the US Federal Reserve: the regulator is not expected to increase the interest rate during the September meeting but tightening monetary policy by the end of the year is still possible. Inflation statistics for August are in focus, with forecasts of growth from 0.2% to 0.5% MoM, while the annual rate is expected to remain close to 3.2% YoY.
The Canadian dollar is supported by strong August labor market data published on Friday: employment increased by 39.9K after a contraction of 6.4K last month, although experts expected an increase of only 15.0K. Average hourly wages adjusted from 5.0% to 5.2%, and the unemployment rate remained at 5.5%, contrary to forecasts of growth to 5.6%.
Support and resistance
On the daily chart, Bollinger Bands are trying to reverse horizontally: the price range is narrowing from below, reflecting the emergence of ambiguous trading dynamics in the short term. The MACD indicator reversed downwards, forming a new sell signal (the histogram is below the signal line). Stochastic is retreating from its highs, which signaled that the US dollar might become overbought in the ultra-short term.
Resistance levels: 1.3650, 1.3700, 1.3750, 1.3800.
Support levels: 1.3600, 1.3550, 1.3500, 1.3450.
Trading tips
Short positions may be opened after a breakdown of 1.3600 with the target at 1.3500. Stop loss – 1.3650. Implementation time: 2–3 days.
Long positions may be opened after a rebound from 1.3600 and a breakout of 1.3650 with
Disclaimer: The content above represents only the views of the author or guest. It does not represent any views or positions of FOLLOWME and does not mean that FOLLOWME agrees with its statement or description, nor does it constitute any investment advice. For all actions taken by visitors based on information provided by the FOLLOWME community, the community does not assume any form of liability unless otherwise expressly promised in writing.
FOLLOWME Trading Community Website: https://www.followme.com


Hot
No comment on record. Start new comment.