GBP/USD: WAITING FOR STATISTICS ON THE BRITISH LABOR MARKET

| Scenario | |
|---|---|
| Timeframe | Intraday |
| Recommendation | BUY STOP |
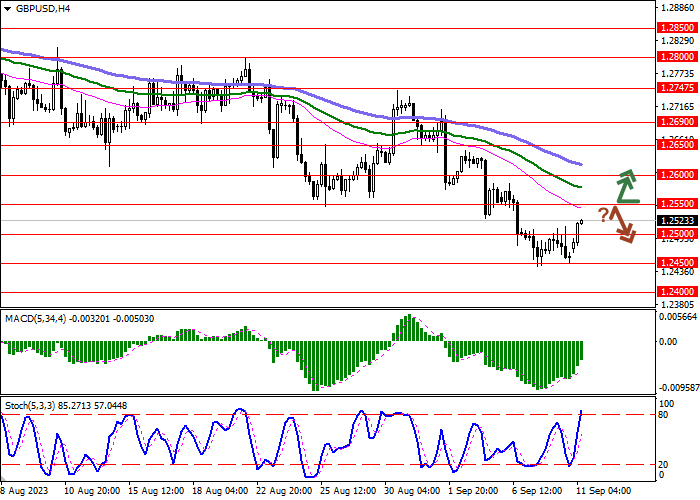
| Entry Point | 1.2550 |
| Take Profit | 1.2650 |
| Stop Loss | 1.2500 |
| Key Levels | 1.2350, 1.2400, 1.2450, 1.2500, 1.2550, 1.2600, 1.2650, 1.2690 |
| Alternative scenario | |
|---|---|
| Recommendation | SELL STOP |
| Entry Point | 1.2500 |
| Take Profit | 1.2400 |
| Stop Loss | 1.2550 |
| Key Levels | 1.2350, 1.2400, 1.2450, 1.2500, 1.2550, 1.2600, 1.2650, 1.2690 |
Current trend
The GBP/USD pair is trading higher, trying to consolidate above 1.2500. The development of upward dynamics in the instrument is facilitated by technical factors, while there are no drivers for the growth of the pound at the beginning of the week.
Today, investors' attention will be focused on the speech of Bank of England representative Huw Pill, who may update his own forecasts regarding further tightening of monetary policy in the country. The Services PMI, which has supported the national economy since January, adjusted in August from 51.5 points to 49.5 points, the Manufacturing PMI decreased from 45.3 points to 43.0 points, and the Construction PMI corrected from 51.7 points to 50.8 points, increasing the risks of a recession. Tomorrow, data on the labor market will be published in the UK. In particular, investors expect a slight increase in the Unemployment Rate over a three-month period from 4.2% to 4.3%, and Average Earnings Excluding Bonus may slow down from 7.8% to 7.6%. Forecasts also suggest a contraction in Industrial Production on Wednesday by 0.5% after growth of 1.8% in the previous month, while Employment Change could adjust from 66.0 thousand to 75.0 thousand.
With the opening of the US session on Wednesday, the focus of the market will shift to statistics from the US, when the data on inflation dynamics for August will be published. Experts suggest that the monthly growth rate of the Consumer Price Index may accelerate from 0.2% to 0.5%. If the forecasts come true, the pressure on the US Federal Reserve regarding a possible interest rate increase in November will increase significantly.
Support and resistance
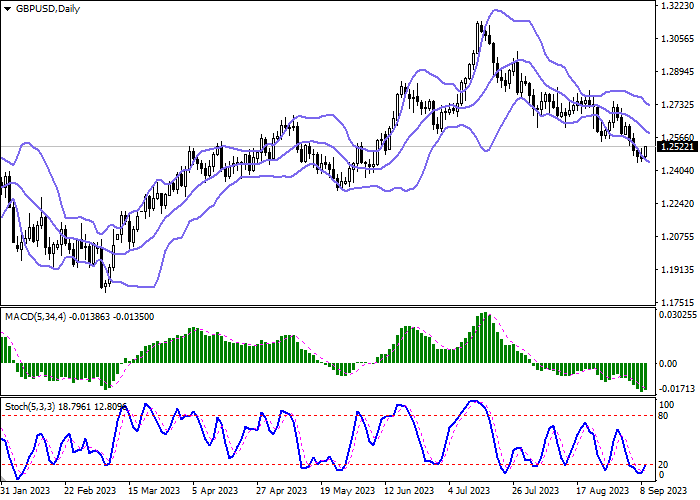
Bollinger Bands in D1 chart demonstrate a moderate decrease. The price range is slightly narrowed from above, being spacious enough for the current activity level in the market. MACD indicator reverses to growth while preparing to form a new buy signal (the histogram is about to consolidate above the signal line). Stochastic, having retreated from its lows, is preparing to test the level of "20" for a breakout. The indicator readings signal in favor of the development of corrective growth in the near future.
Resistance levels: 1.2550, 1.2600, 1.2650, 1.2690.
Support levels: 1.2500, 1.2450, 1.2400, 1.2350.

Trading tips
Long positions can be opened after a breakout of 1.2550 with the target of 1.2650. Stop-loss — 1.2500. Implementation time: 2-3 days.
A rebound from 1.2550 as from resistance, followed by a breakdown of 1.2500 may become a signal for opening of new short positions with the target at 1.2400. Stop-loss — 1.2550.
Disclaimer: The content above represents only the views of the author or guest. It does not represent any views or positions of FOLLOWME and does not mean that FOLLOWME agrees with its statement or description, nor does it constitute any investment advice. For all actions taken by visitors based on information provided by the FOLLOWME community, the community does not assume any form of liability unless otherwise expressly promised in writing.
FOLLOWME Trading Community Website: https://www.followme.com


Hot
No comment on record. Start new comment.