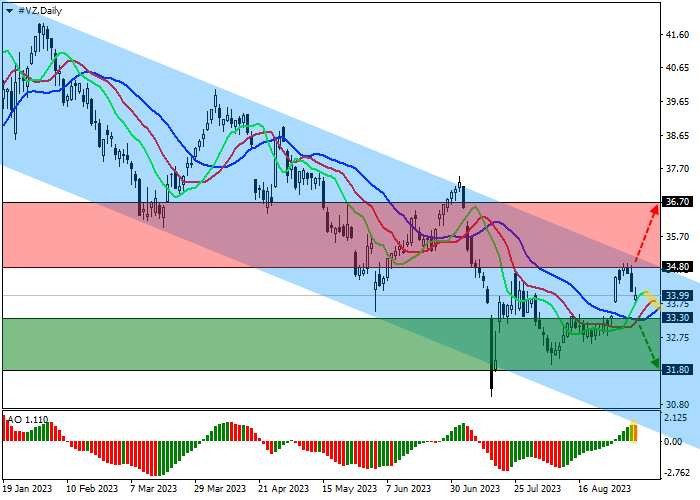
Saham Verizon Communications Inc., salah satu perusahaan telekomunikasi terbesar AS, terkoreksi mendekati 34.00.
Pada grafik harian, harga bergerak dalam tren korektif, bertahan dalam koridor penurunan global dengan batas dinamis 35.00–30.00.
Pada grafik empat jam, setelah mencapai garis resistance di 35.00, harga berbalik ke bawah. Skenario yang paling mungkin terjadi adalah perkembangan kesenjangan harga antara level 33.70–33.30.
Indikator teknis melemahkan sinyal beli: fast EMA pada indikator Alligator mendekati garis sinyal, dan histogram AO telah membentuk bilah turun pertama di zona beli.
Tips perdagangan
Posisi sell dapat dibuka setelah harga turun dan berkonsolidasi di bawah 33.30 dengan target di 31.80. Stop loss — 34.00. Periode implementasi: 7 hari atau lebih.
Posisi buy dapat dibuka setelah pembalikan, pertumbuhan, dan konsolidasi harga di atas 34.80 dengan target di 36.70. Stop loss – 33.80.
Disclaimer: The content above represents only the views of the author or guest. It does not represent any views or positions of FOLLOWME and does not mean that FOLLOWME agrees with its statement or description, nor does it constitute any investment advice. For all actions taken by visitors based on information provided by the FOLLOWME community, the community does not assume any form of liability unless otherwise expressly promised in writing.


Hot
No comment on record. Start new comment.