CATERPILLAR INC.: TECHNICAL ANALYSIS


| Scenario | |
|---|---|
| Timeframe | Weekly |
| Recommendation | BUY STOP |
| Entry Point | 288.05 |
| Take Profit | 305.00 |
| Stop Loss | 283.00 |
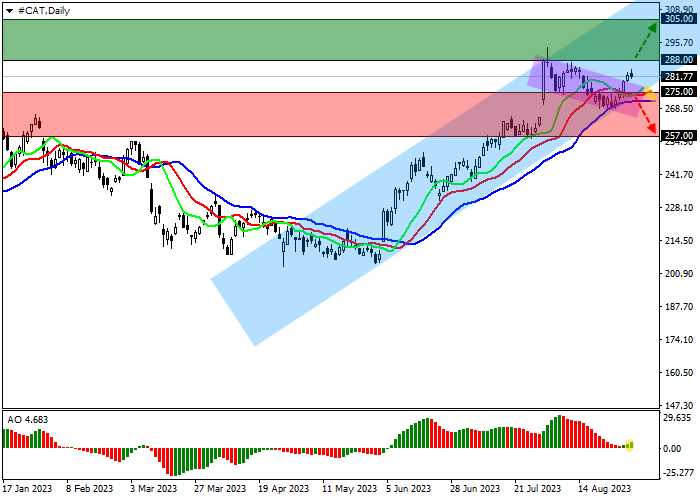
| Key Levels | 257.00, 275.00, 288.00, 305.00 |
| Alternative scenario | |
|---|---|
| Recommendation | SELL STOP |
| Entry Point | 274.95 |
| Take Profit | 257.00 |
| Stop Loss | 280.00 |
| Key Levels | 257.00, 275.00, 288.00, 305.00 |
Shares of Caterpillar Inc., a global manufacturer of construction and mining equipment, are trading in a global corrective trend at 282.00.
On the daily chart, the price is moving within the global ascending corridor with dynamic boundaries of 295.00–268.00, getting ready for continued growth.
On the four-hour chart, a local decrease occurs within the channel 280.00–266.00, which can work as a pattern to continue the Flag trend.
Technical indicators keep a stable buy signal: fast EMAs on the Alligator indicator are far from the signal line, and the AO histogram forms corrective bars above the transition level.
Trading tips
Long positions may be opened after the price rises and consolidates above 288.00 with the target at 305.00. Stop loss – 283.00. Implementation period: 7 days or more.
Short positions may be opened after a reversal, reduction, and consolidation of the price below 275.00 with the target at 257.00. Stop loss – 280.00.
Disclaimer: The content above represents only the views of the author or guest. It does not represent any views or positions of FOLLOWME and does not mean that FOLLOWME agrees with its statement or description, nor does it constitute any investment advice. For all actions taken by visitors based on information provided by the FOLLOWME community, the community does not assume any form of liability unless otherwise expressly promised in writing.
FOLLOWME Trading Community Website: https://www.followme.com


Hot
No comment on record. Start new comment.