XAU/USD 显示波动收缩在 1,920 美元附近!

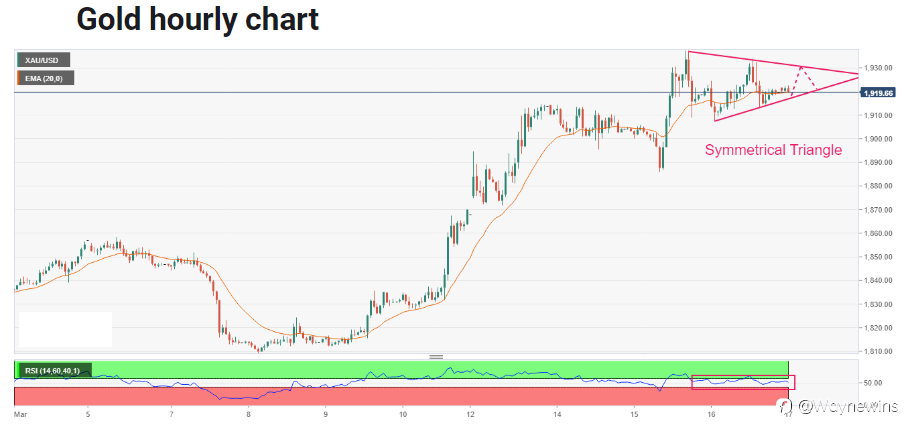
黄金价格在小时尺度上以对称三角形图表模式进行拍卖,这表明波动性紧缩,随后波动性扩大。上述图表形态的向下倾斜趋势线位于 3 月 15 日高点 1,939.40 美元附近,而向上倾斜趋势线位于 3 月 16 日低点 1,907.56 美元附近。
与资产重叠的 20 周期指数移动平均线 (EMA) 为 1,919.60 美元表明区间波动。
此外,相对强弱指数 (RSI) (14) 在 40.00-60.00 范围内震荡,这表明投资者正在等待进一步行动的潜在触发因素。
Disclaimer: The content above represents only the views of the author or guest. It does not represent any views or positions of FOLLOWME and does not mean that FOLLOWME agrees with its statement or description, nor does it constitute any investment advice. For all actions taken by visitors based on information provided by the FOLLOWME community, the community does not assume any form of liability unless otherwise expressly promised in writing.
FOLLOWME Trading Community Website: https://www.followme.com


Hot
No comment on record. Start new comment.