什么是条柱和烛台?为什么条形图和烛台很重要?

什么是条柱和烛台?
· 图表是历史价格的图形表示。最常见的图表类型是条形图和烛台图。尽管这两种图表类型看起来截然不同,但它们提供的信息非常相似。
· 条形图和烛台图分为不同的时间范围。每个条形图或烛台代表特定时间段内的高、低开盘价和收盘价。
· 查看日线图时,每根柱线/蜡烛代表一天的交易活动
· 查看 15 分钟图表时,每根柱状图/蜡烛图代表 15 分钟的交易活动时段或时段。
为什么条形图和烛台很重要?
技术分析包括通过各种技术指标或研究来研究和绘制趋势和价格模式。价格与时间之间的这种关系不仅可以帮助交易者查看和解读更多数据,还可以帮助查明犹豫不决或情绪逆转的领域。因此,技术分析用于帮助确定进入和退出的概率,以便制定策略或方法。
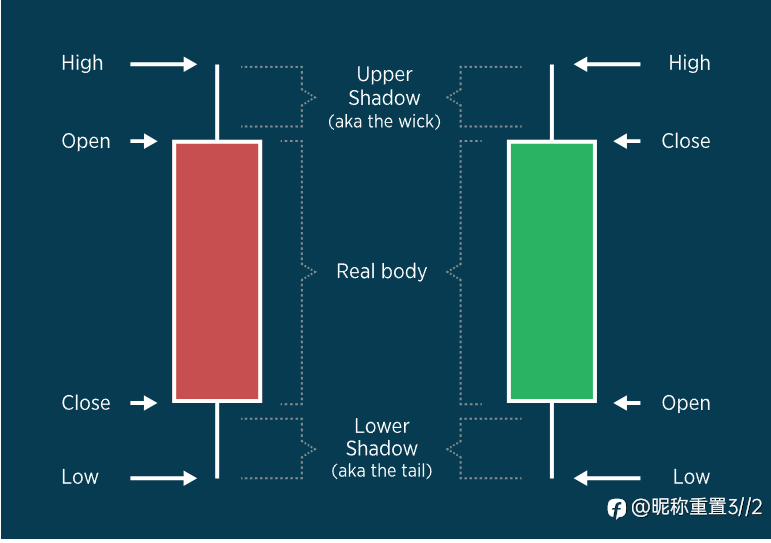
示例 1 – 烛台
看跌蜡烛通常是红色的。这意味着开盘价在指定的时间间隔内高于收盘价。看涨蜡烛通常是绿色的。这意味着开盘价在指定的时间间隔内低于收盘价。
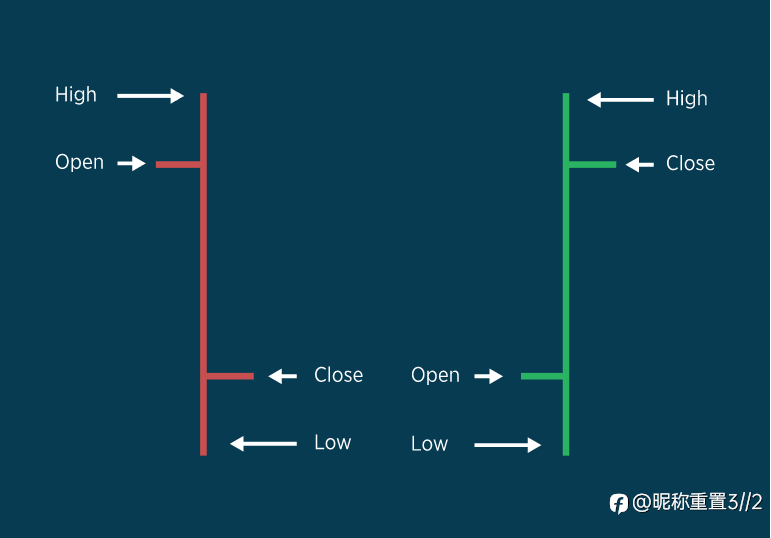
示例 2 – 酒吧
看跌柱线通常为红色。这意味着开盘价在指定的时间间隔内高于收盘价。看涨柱线通常为绿色。这意味着开盘价在指定的时间间隔内低于收盘价。
Disclaimer: The content above represents only the views of the author or guest. It does not represent any views or positions of FOLLOWME and does not mean that FOLLOWME agrees with its statement or description, nor does it constitute any investment advice. For all actions taken by visitors based on information provided by the FOLLOWME community, the community does not assume any form of liability unless otherwise expressly promised in writing.
FOLLOWME Trading Community Website: https://www.followme.com


Hot
No comment on record. Start new comment.