XRP, Ethereum Classic, Zcash Price Analysis: 11 January

After XRP lost the 61.8% Fibonacci support, the bulls needed to uphold the $0.729-level to prevent further crashes. After poking their multi-month lows in the last few days, Ethereum Classic and Zcash flashed a bearish bias in the near term.
XRP
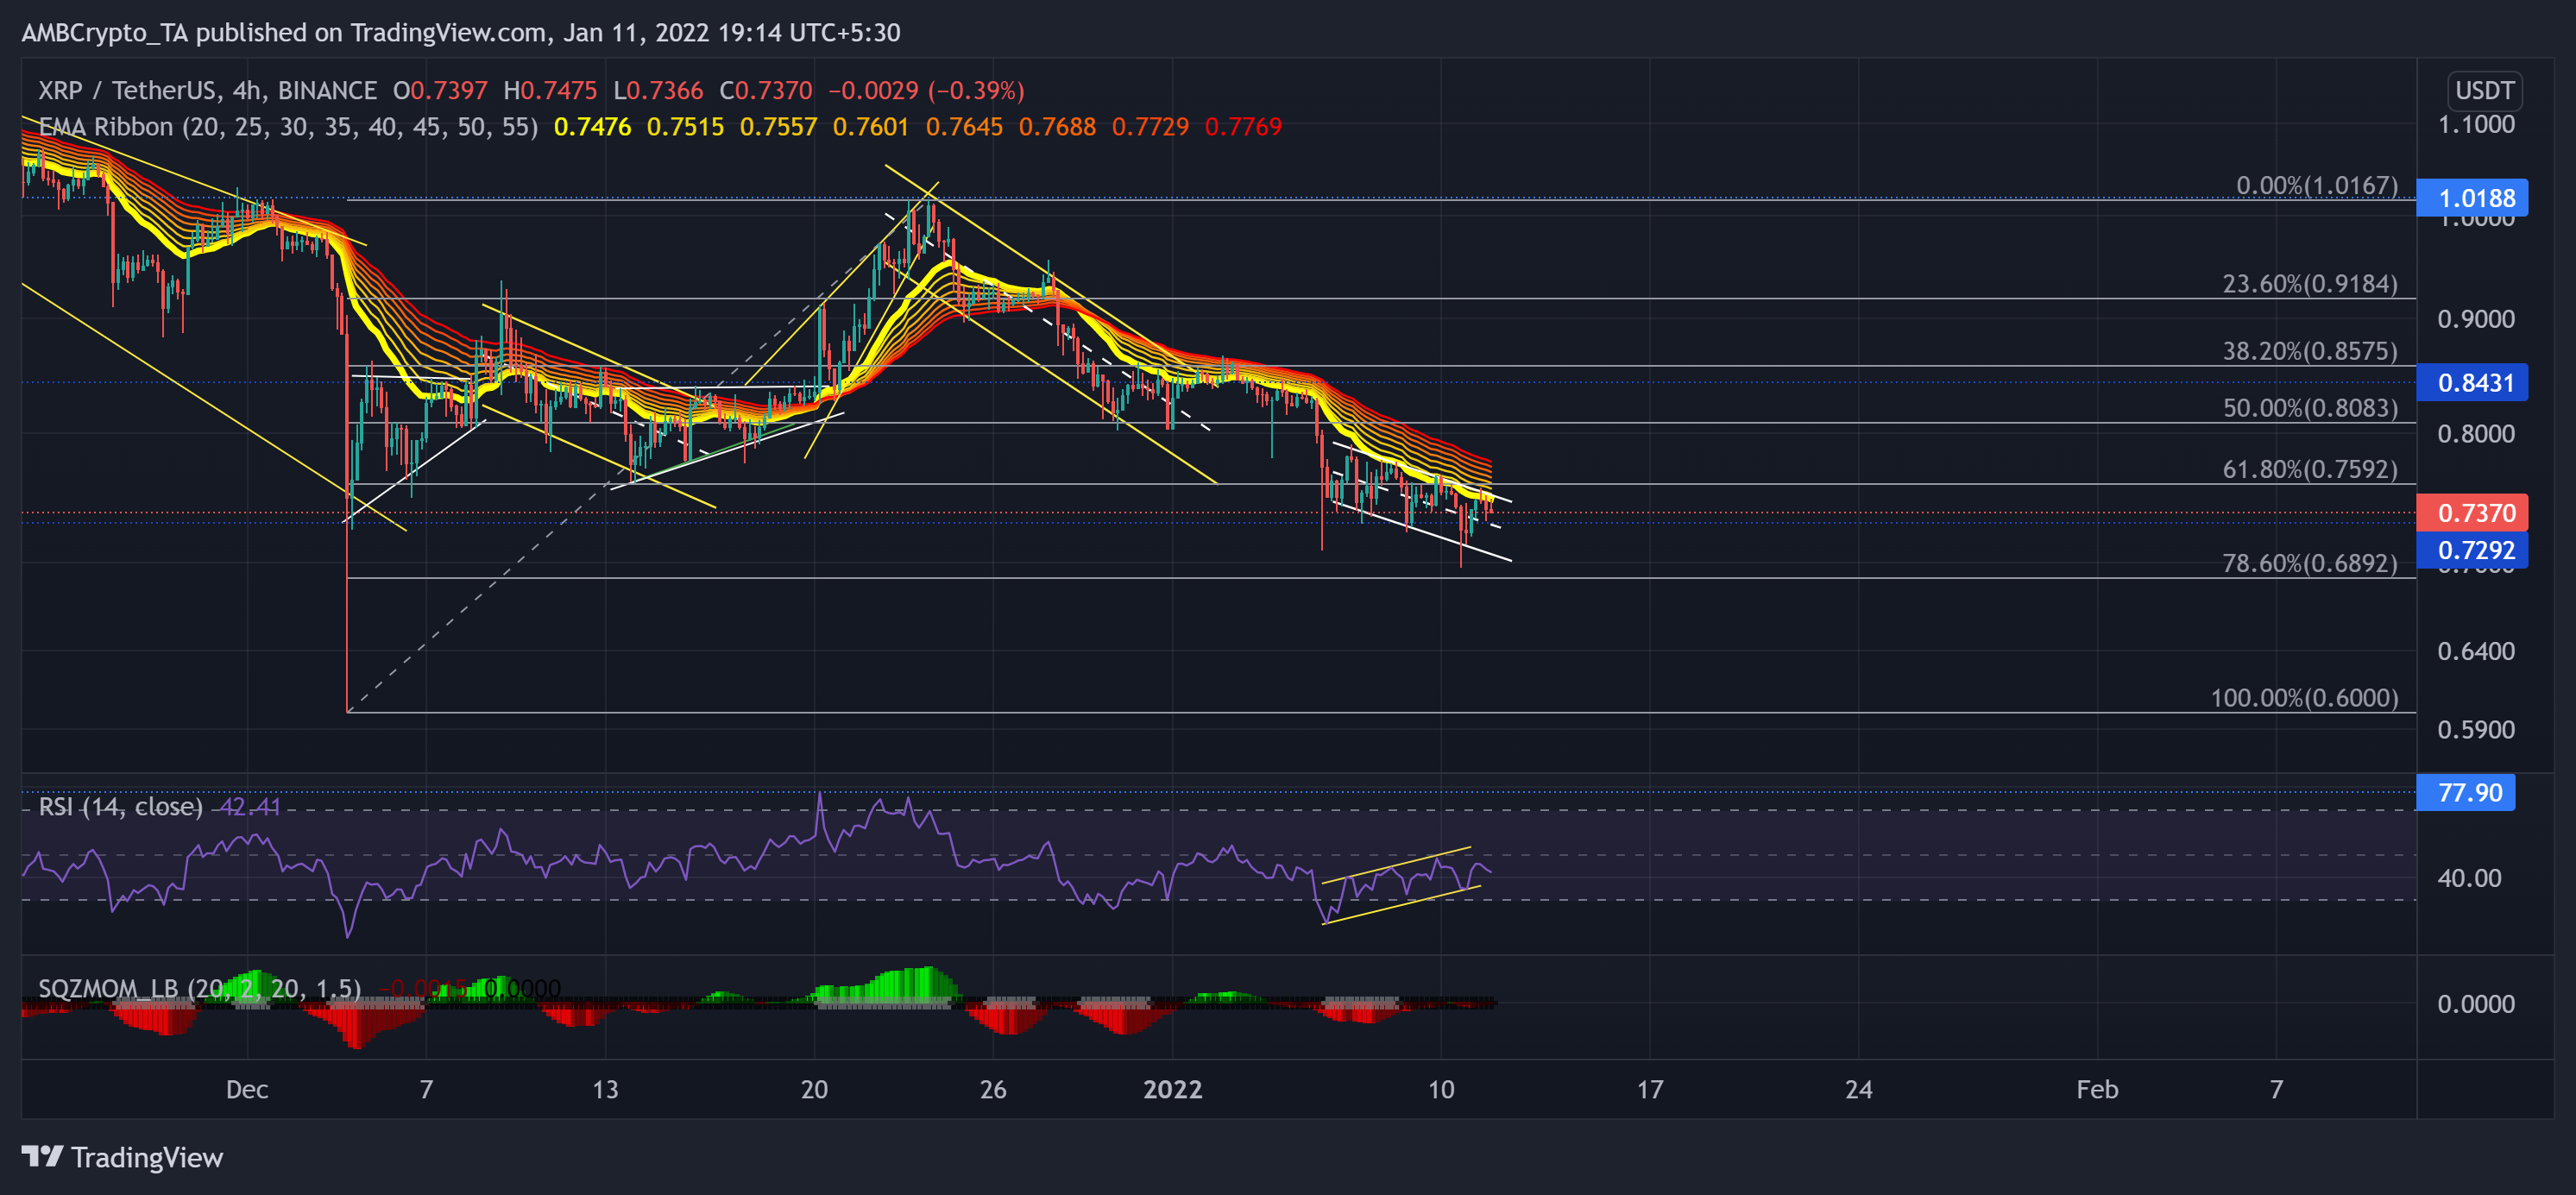
TradingView, XRP/USDT
XRP downturned from the $1.01-mark resistance and formed two down-channels on its 4-hour chart over the past 20 days. With the recent fall, the alt marked a 31.41% retracement and lost the vital 61.8% Fibonacci support.
Over the past four days, the alt retested the $0.7292-mark support multiple times while the 20 EMA (dark yellow) stood as a resistance point. As a result, the Squeeze Momentum Indicator flashed a low volatility phase. Now, the $0.7292-mark becomes crucial to uphold to prevent a fallout to $0.7.
At press time, XRP traded at $0.737. The RSI took a conflicting position by forming an up-channel. Nevertheless, it still struggled to cross the half-line.
Ethereum Classic (ETC)
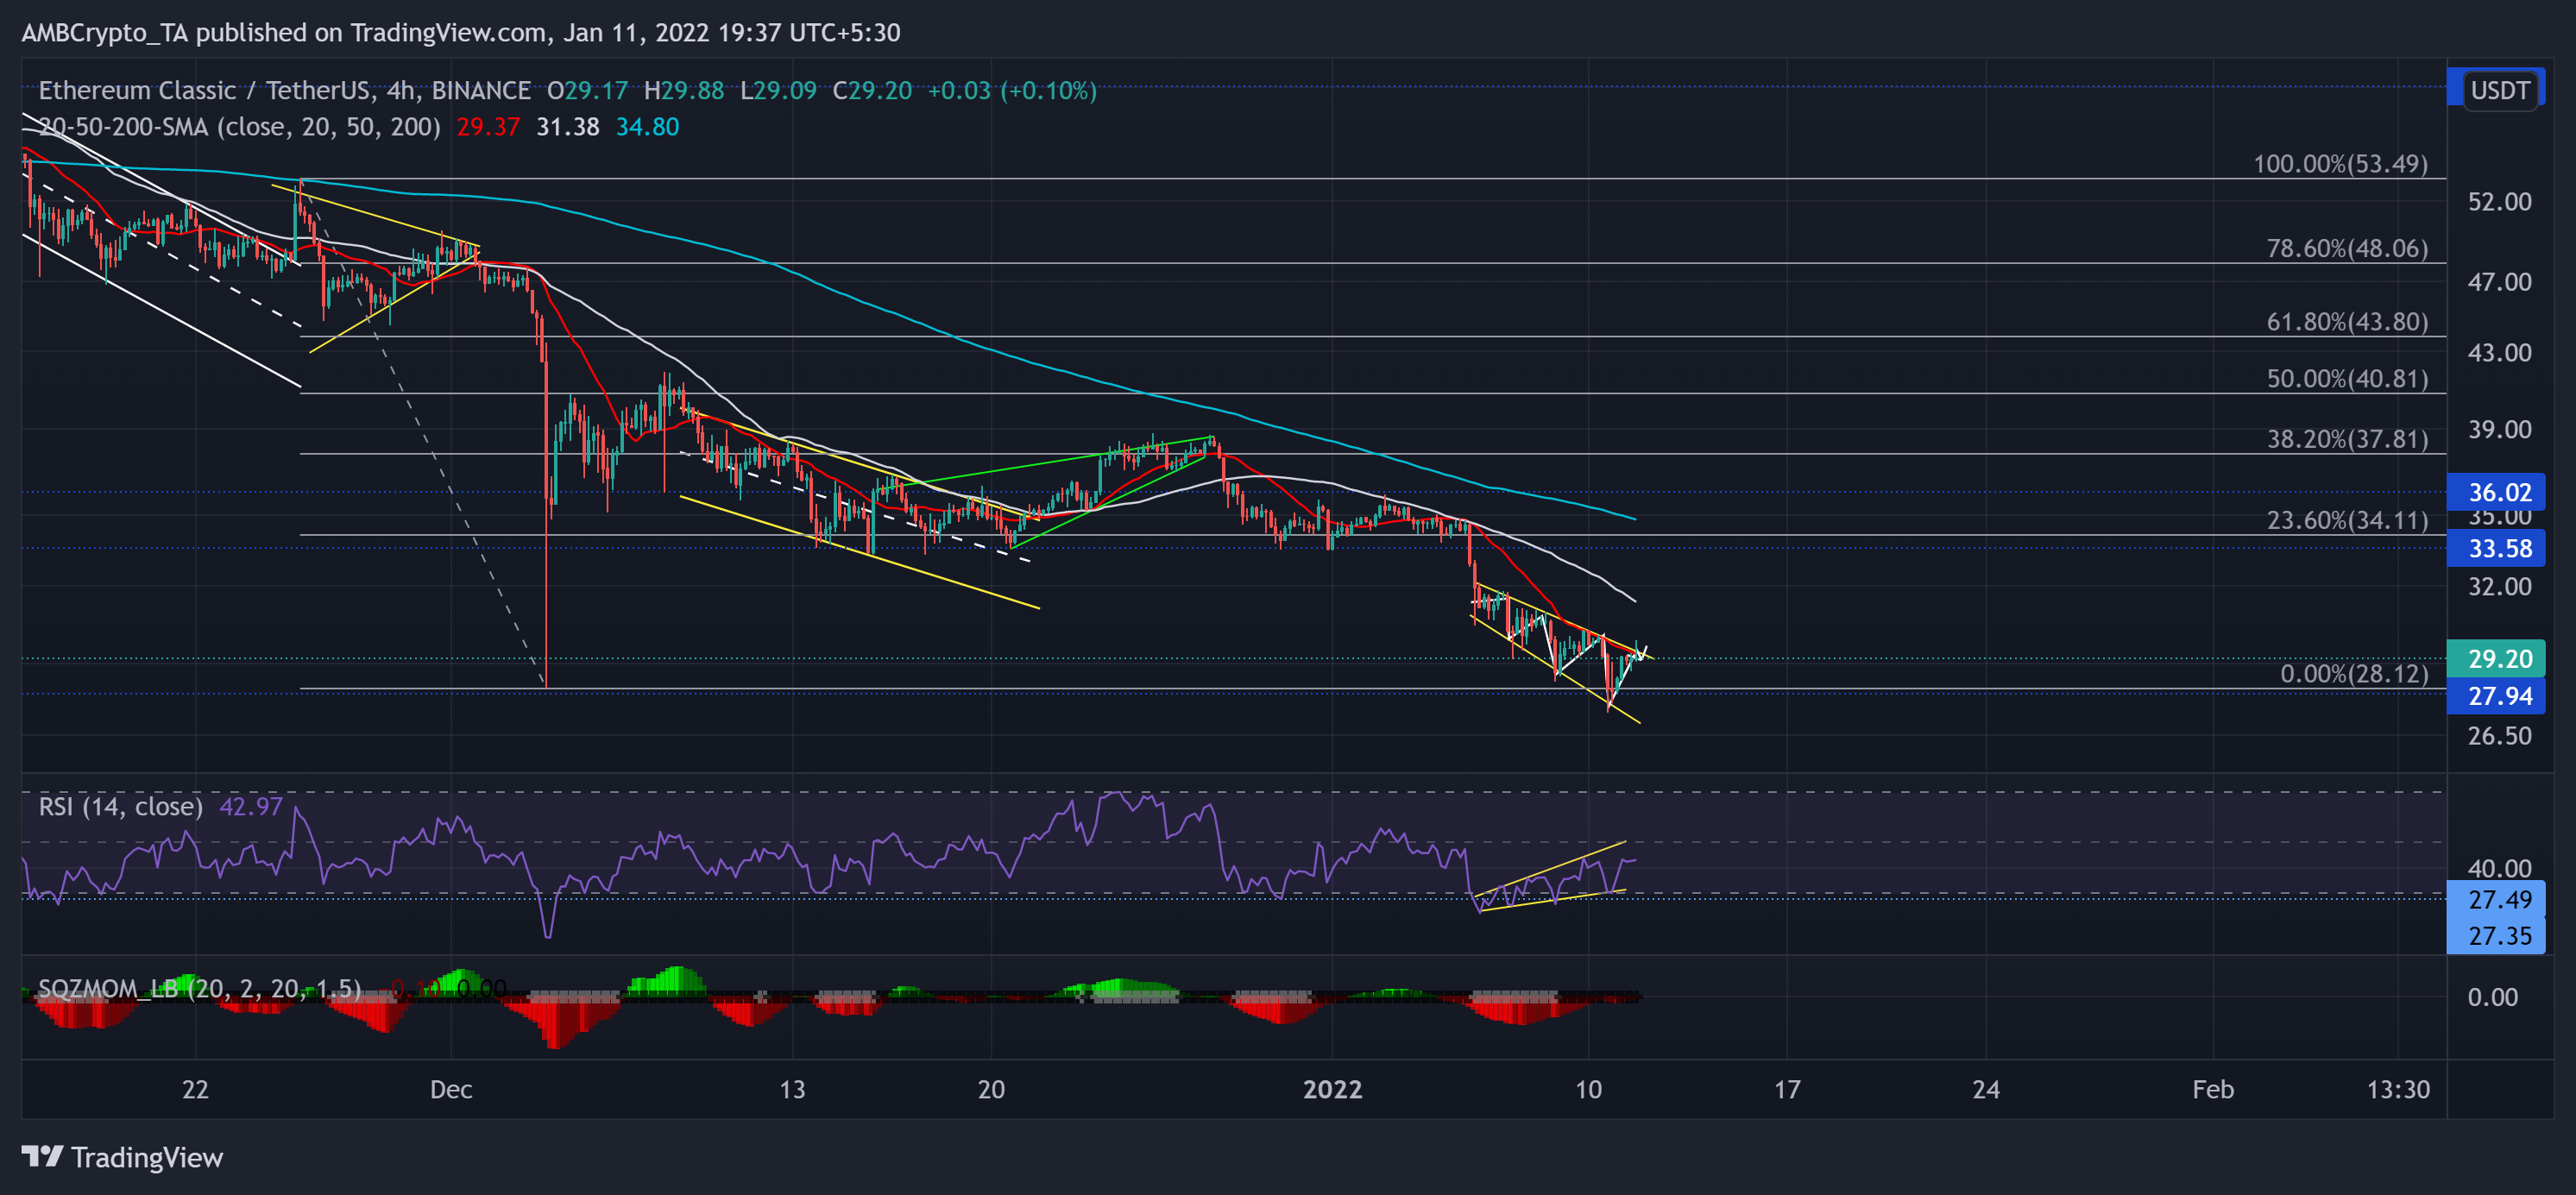
TradingView, ETC/USDT
While the down-channel (yellow) found support at the $33-mark, a rising wedge reversal obliged the 38.2% Fibonacci resistance. After briefly oscillating between the $36 and $33-range near its Point Of Control (red), ETC succumbed to a broader sell-off.
It marked a 29.8% correction (from 27 December high) until it poked its 37-week low on 10 January. Now, ETC formed a descending broadening wedge (yellow, reversal pattern) and plunged below its 20-50-200 SMA. Upholding the $27.9-mark would be paramount for a potential breakout.
At press time, ETC traded at $29.2. The RSI showed improvement signs but still struggled to cross the half-line. On the other hand, the Squeeze Momentum Indicator continued to flash black dots, hinting at a low volatility phase.
ZCash (ZEC)
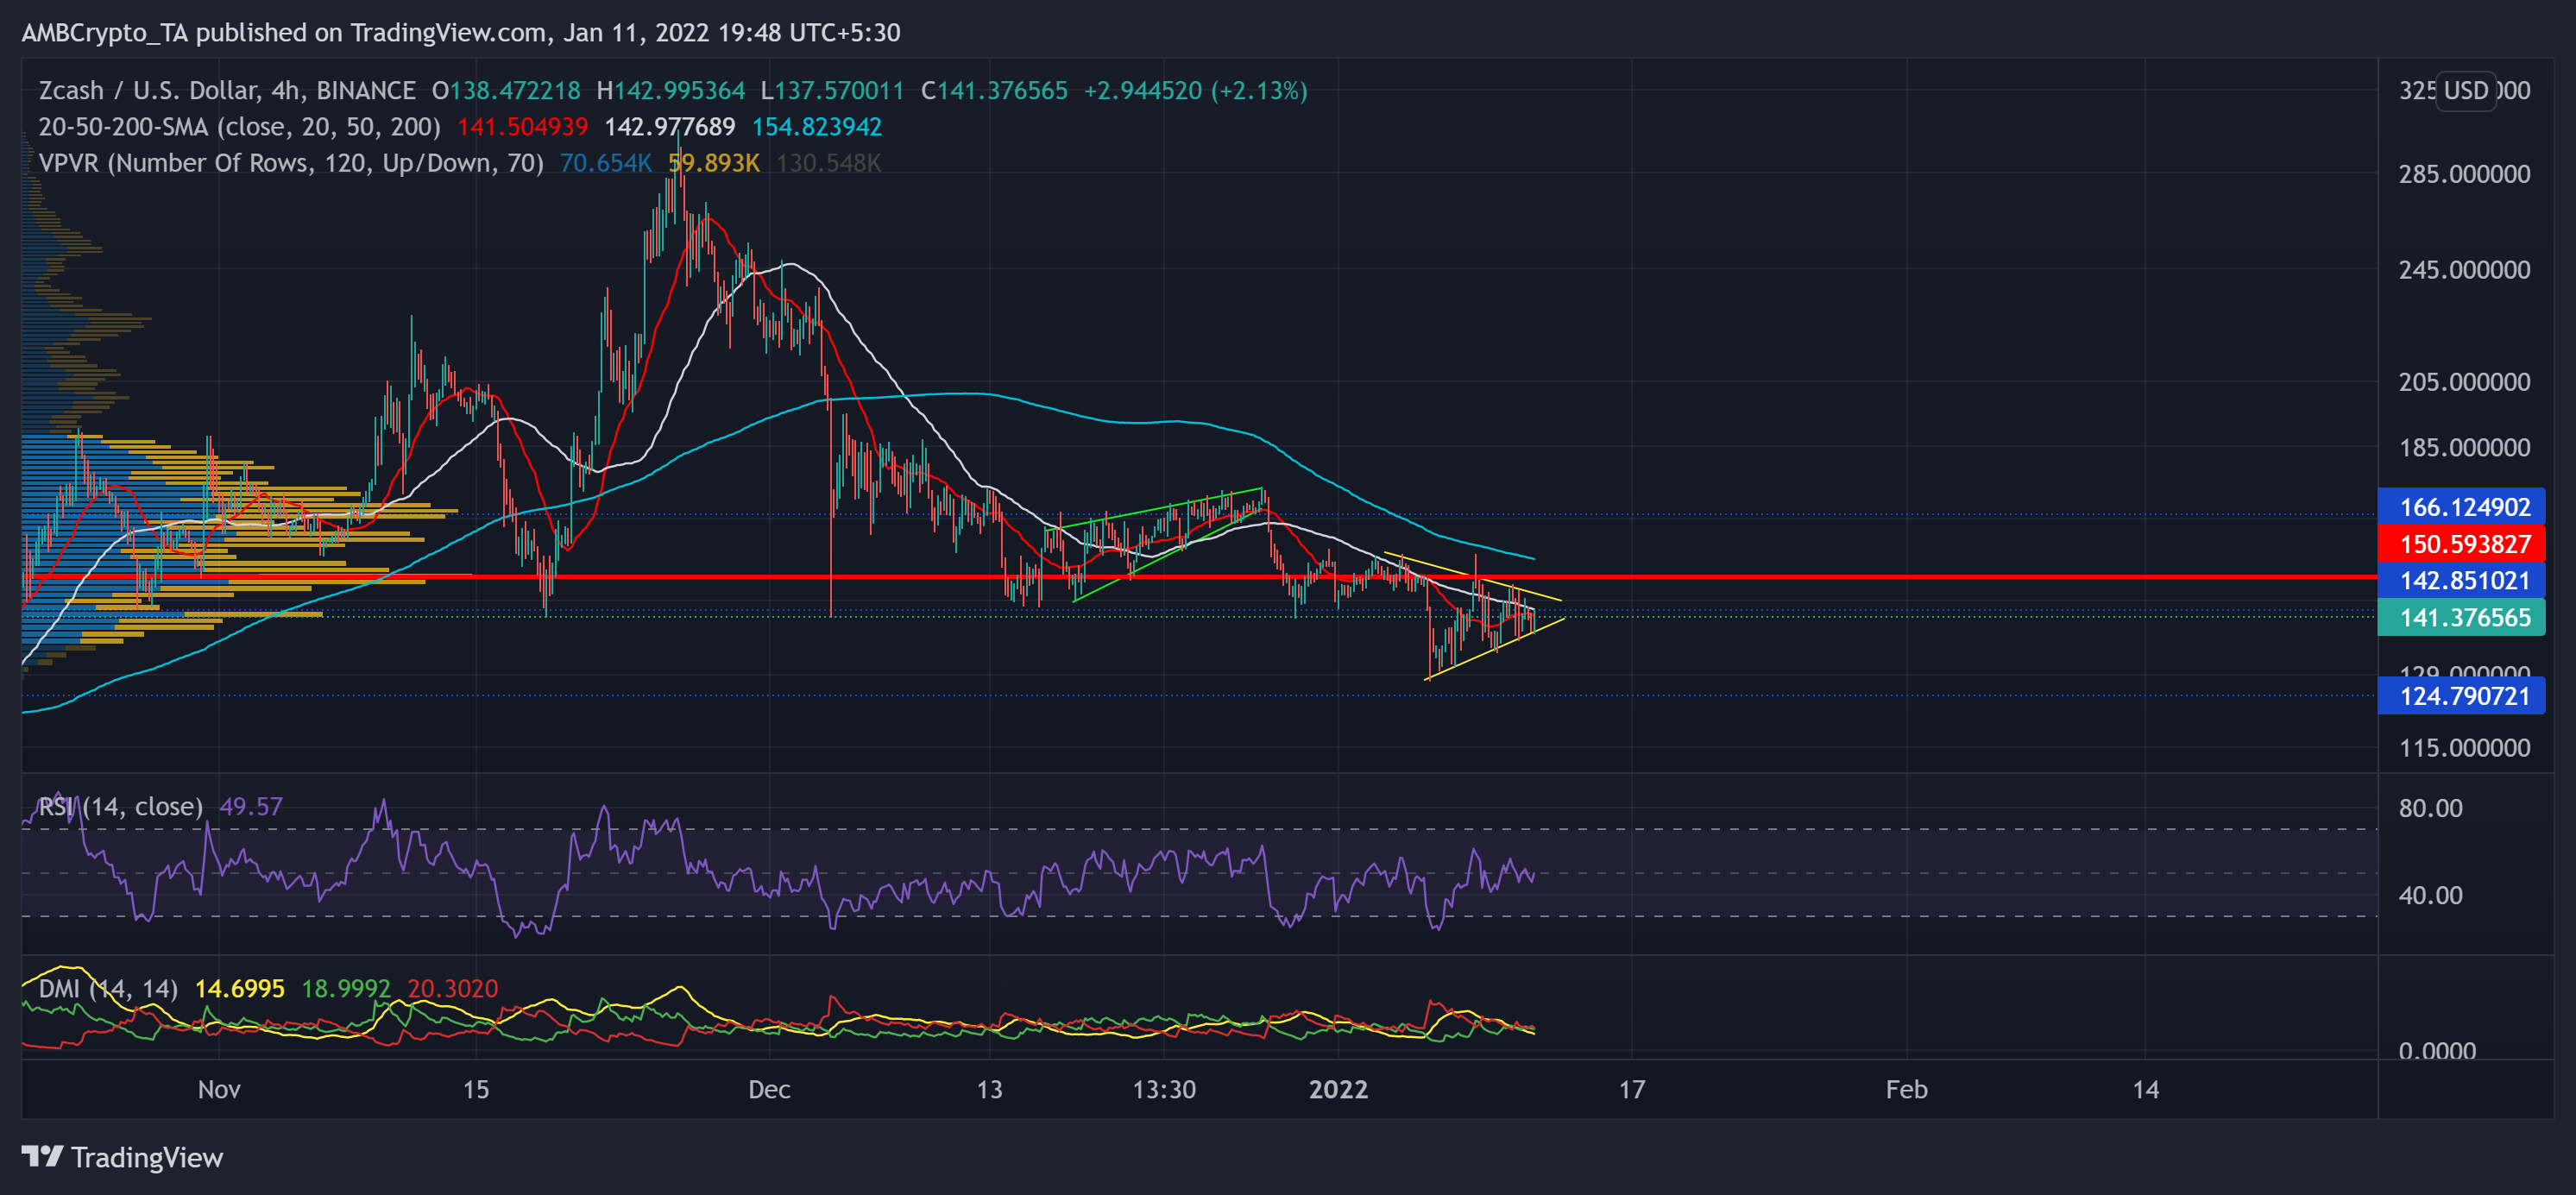
TradingView, ZEC/USD
Over the past few days, ZEC formed a symmetrical triangle (yellow) on its 4-hour chart. After the rising wedge (green) saw a breakdown from the $166-resistance, the alt marked a 25.5% decline 11-week low on 6 January. The recent pushed the alt below its long-term Point of Control (red) and flashed a bearish bias.
At press time, ZEC traded 95.6% below its ATH at $141.37. The trading price was below the 4-hour 20-50 SMA while the RSI stood slightly below the half-line. These readings indicated a marginal preference for sellers. Additionally, the DMI chose the bears, but the ADX depicted a weak directional trend for ZEC.
© ambcrypto. Copyright and all rights therein are retained by authors.
Disclaimer: The content above represents only the views of the author or guest. It does not represent any views or positions of FOLLOWME and does not mean that FOLLOWME agrees with its statement or description, nor does it constitute any investment advice. For all actions taken by visitors based on information provided by the FOLLOWME community, the community does not assume any form of liability unless otherwise expressly promised in writing.
FOLLOWME Trading Community Website: https://www.followme.com


Hot
No comment on record. Start new comment.