A triangle chart pattern involves price moving into a tighter and tighter range as time goes by and provides a visual display of a battle between bulls and bears.
The triangle pattern is generally categorized as a “continuation pattern”, meaning that after the pattern completes, it’s assumed that the price will continue in the trend direction it was moving before the pattern appeared.
A triangle pattern is generally considered to be forming when it includes at least five touches of support and resistance.
For example, three touches of the support line and two for the resistance line. Or vice versa.
Just like there are three little pigs, there are three types of triangle chart formations: symmetrical triangle, ascending triangle, and descending triangle.
Symmetrical Triangle
A symmetrical triangle is a chart formation where the slope of the price’s highs and the slope of the price’s lows converge together to a point where it looks like a triangle.
What’s happening during this formation is that the market is making lower highs and higher lows.
This means that neither the buyers nor the sellers are pushing the price far enough to make a clear trend.
If this were a battle between the buyers and sellers, then this would be a draw.
This is also a type of consolidation.
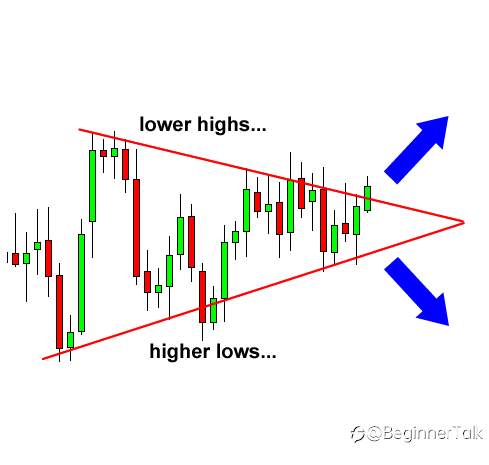
In the chart above, we can see that neither the buyers nor the sellers could push the price in their direction. When this happens we get lower highs and higher lows.
As these two slopes get closer to each other, it means that a breakout is getting near.
We don’t know what direction the breakout will be, but we do know that the market will most likely break out. Eventually, one side of the market will give in.
So how can we take advantage of this?
Simple.
We can place entry orders above the slope of the lower highs and below the slope of the higher lows of the symmetrical triangle.
Since we already know that the price is going to break out, we can just hitch a ride in whatever direction the market moves.
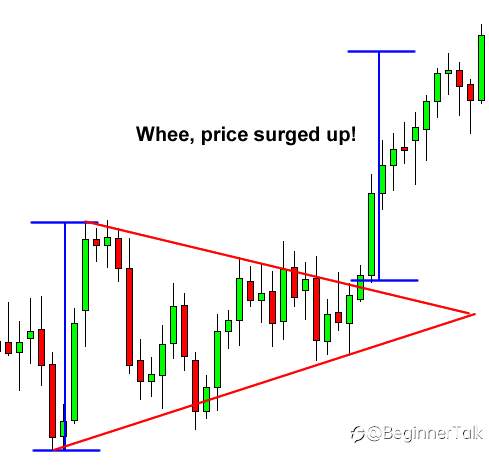
In this example, if we placed an entry order above the slope of the lower highs, we would’ve been taken along for a nice ride up.
If you had placed another entry order below the slope of the higher lows, then you would cancel it as soon as the first order was hit.
Ascending Triangle
An ascending triangle is a type of triangle chart pattern that occurs when there is a resistance level and a slope of higher lows.
What happens during this time is that there is a certain level that the buyers cannot seem to exceed. However, they are gradually starting to push the price up as evidenced by the higher lows.

In the chart above, you can see that the buyers are starting to gain strength because they are making higher lows.
They keep putting pressure on that resistance level and as a result, a breakout is bound to happen.
Now the question is, “Which direction will it go? Will the buyers be able to break that level or will the resistance be too strong?”
Many charting books will tell you that in most cases, the buyers will win this battle and the price will break out past the resistance.
However, it has been our experience that this is not always the case.
Sometimes the resistance level is too strong, and there is simply not enough buying power to push it through.
Most of the time, the price will, in fact, go up. The point we are trying to make is that you should not be obsessed with which direction the price goes, but you should be ready for movement in EITHER direction.
In this case, we would set an entry order above the resistance line and below the slope of the higher lows.
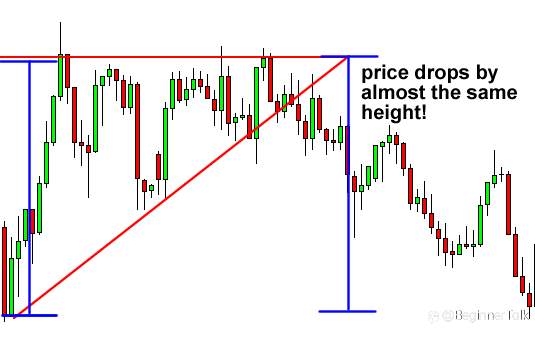
In this scenario, the buyers lost the battle and the price proceeded to dive! You can see that the drop was approximately the same distance as the height of the triangle formation.
If we set our short order below the bottom of the triangle, we could’ve caught some pips off that dive.
Descending Triangle
As you probably guessed, descending triangles are the exact opposite of ascending triangles (we knew you were smart!).
In descending triangle chart patterns, there is a string of lower highs that forms the upper line. The lower line is a support level in which the price cannot seem to break.
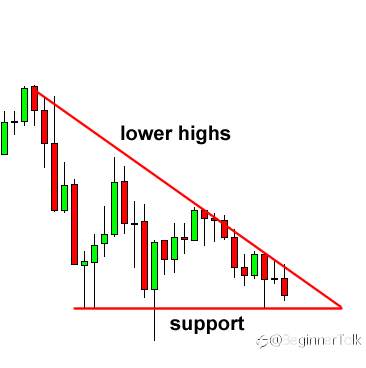
In the chart above, you can see that the price is gradually making lower highs which tells us that the sellers are starting to gain some ground against the buyers.
Now most of the time, and we do say MOST, the price will eventually break the support line and continue to fall.
However, in some cases, the support line will be too strong, and the price will bounce off of it and make a strong move up.
The good news is that we don’t care where the price goes. We just know that it’s about to go somewhere.
In this case, we would place entry orders above the upper line (the lower highs) and below the support line.
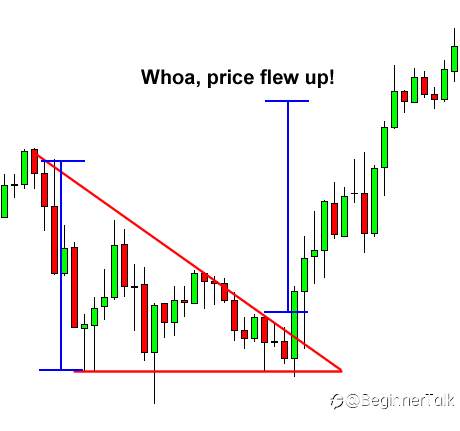
In this case, the price ended up breaking above the top of the triangle pattern.
After the upside breakout, it proceeded to surge higher, by around the same vertical distance as the height of the triangle.
Placing an entry order above the top of the triangle and going for a target as high as the height of the formation would’ve yielded nice profits.
Reprinted from Babypips,the copyright all reserved by the original author.
Edited 07 Jun 2021, 09:59
Disclaimer: The views expressed are solely those of the author and do not represent the official position of Followme. Followme does not take responsibility for the accuracy, completeness, or reliability of the information provided and is not liable for any actions taken based on the content, unless explicitly stated in writing.

Leave Your Message Now