Illustration photo of Gold Price H4 Chart from fxempire.com
On Friday, gold prices plummeted $66 for the first time since December 2020, below its 200-day moving average. After trading to a low $1828, gold futures closed a low $1836, four dollars below its 200-day moving average.
Today, gold open at $1849, merely $9 above the 200-day moving average and in the evening session traded to an intraday low of $1817 before recovering.
Gold’s most active February 2021Comex is currently fixed at $1847, up by $11.60. Market participants have re-focused their attention to the precious metal after a lower composite trading by all three of the major indices - the Dow, the NASDAQ, and the S&P 500, while Bitcoin also faces a strong sell-off.
The price increase on the yellow metal today has managed to overcome the greenback’s strength. While the dollar is fixed at 90.485, up +0/48%, gold futures are currently trading up +0.63%. A neutral dollar would have seen gold gaining 1.11%.
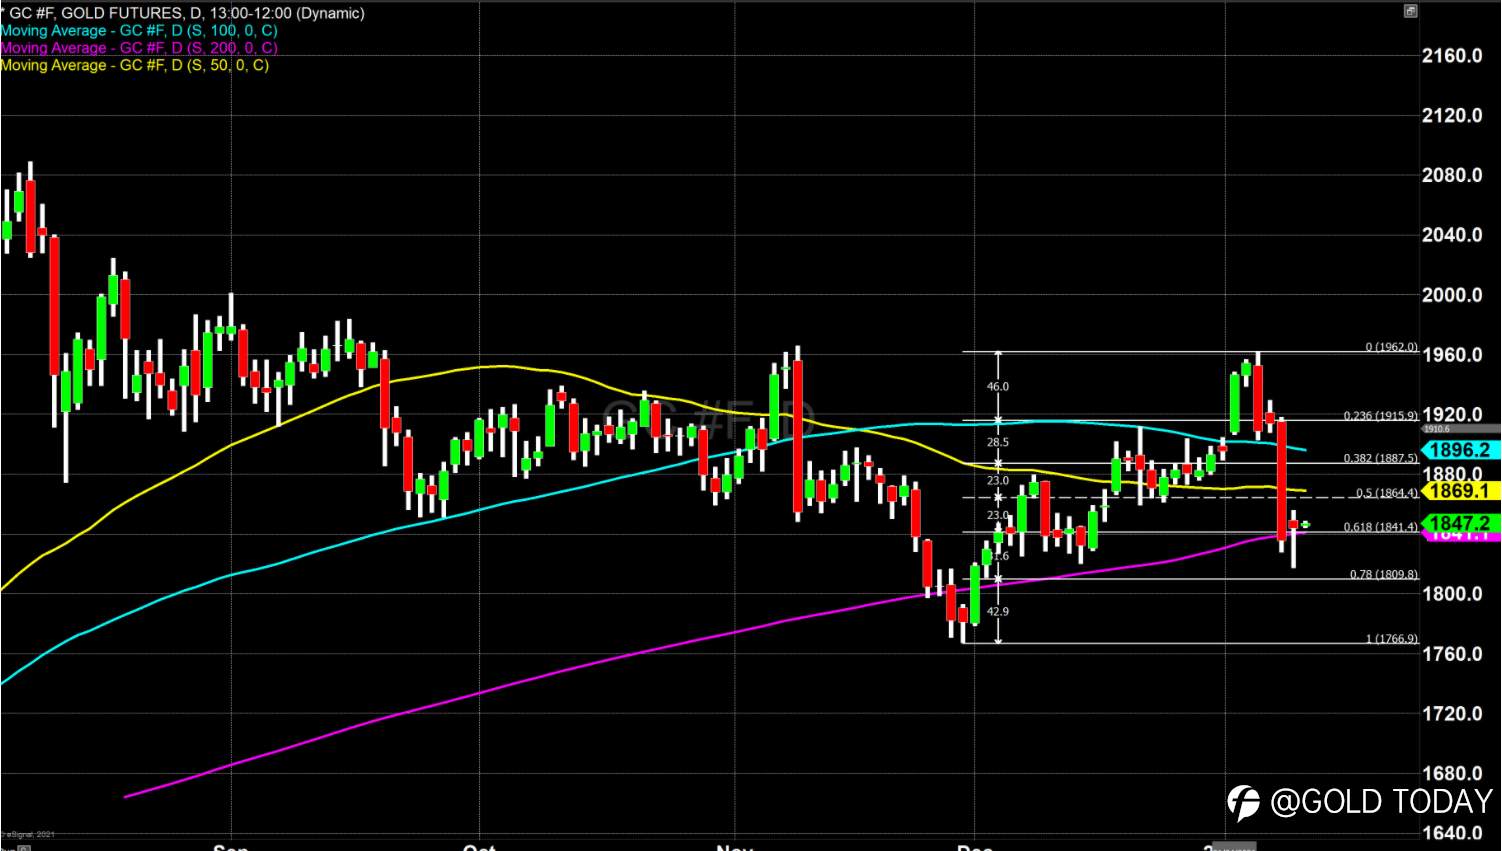
On the technical side, the lowest level of support occurs at 50% retracement, currently fixed at $1768.60 and above that is the 200-day moving average fixed at $1840 currently. That is just above the 38.2% Fibonacci retracement level, a data set beginning in March when gold traded at $1400 to the all-time record high of $2088 in August 2020. While the current pricing of the precious metal is close to levels of support, the first resistance is the current 50-day moving average, occurring at $1869.
FOLLOWME XAU/USD Overall Sentiment (As of 6:29 p.m., Jan 12, 2021)
Short - 50.31%
Long - 49.69%
Source: fxempire.com
Disclaimer: The views expressed are solely those of the author and do not represent the official position of Followme. Followme does not take responsibility for the accuracy, completeness, or reliability of the information provided and is not liable for any actions taken based on the content, unless explicitly stated in writing.

Leave Your Message Now