GBP/USD Price Analysis: Seems vulnerable to slide back towards 1.3200 mark

- GBP/USD remained depressed for the second straight session and retreated further from YTD tops.
- The set-up seems to have shifted in favour of bears and supports prospects for additional weakness.
- Any attempted positive move might confront stiff resistance and remain capped near the 1.3360 region.
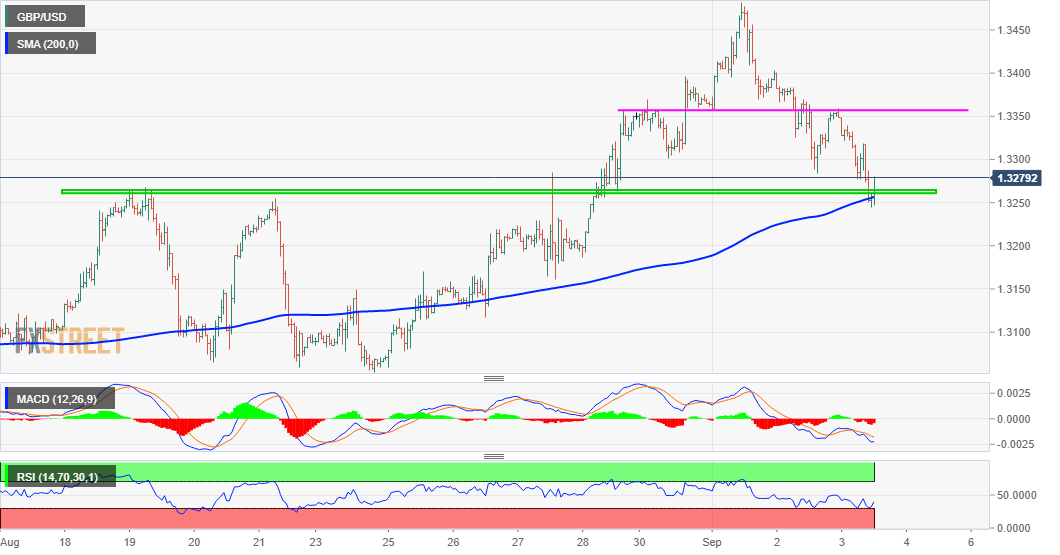
The GBP/USD pair continued losing ground through the mid-European session and slipped below a previous strong resistance breakpoint-turned-support, around the 1.3265-60 area.
The mentioned region coincided with 200-hour SMA and a subsequent weakness will shift the near-term bias back in favour of bearish traders. This, in turn, will pave the way for an extension of this week's corrective slide from the 1.3480 region, or YTD tops.
Meanwhile, technical indicators on hourly charts have been gaining negative traction and support prospects for additional weakness. However, oscillators on the daily chart – through have corrected from higher levels – are still holding in the bullish territory.
Mixed indicators on 4-hourly/daily charts warrant some caution for aggressive bearish traders and positioning for any further depreciating move. That said, some follow-through selling might still turn the pair vulnerable to accelerate the slide towards the 1.3200 mark.
On the flip side, the 1.3300 mark now becomes immediate strong resistance. Any subsequent positive move could get extended but seems more likely to run out of the steam and remain capped near the 1.3355-60 horizontal zone.
GBP/USD 1-hourly chart
Technical levels to watch
GBP/USD
| OVERVIEW | |
|---|---|
| Today last price | 1.3265 |
| Today Daily Change | -0.0086 |
| Today Daily Change % | -0.64 |
| Today daily open | 1.3351 |
| TRENDS | |
|---|---|
| Daily SMA20 | 1.3166 |
| Daily SMA50 | 1.2876 |
| Daily SMA100 | 1.2648 |
| Daily SMA200 | 1.2736 |
| LEVELS | |
|---|---|
| Previous Daily High | 1.3402 |
| Previous Daily Low | 1.3284 |
| Previous Weekly High | 1.3357 |
| Previous Weekly Low | 1.3054 |
| Previous Monthly High | 1.3396 |
| Previous Monthly Low | 1.2982 |
| Daily Fibonacci 38.2% | 1.3329 |
| Daily Fibonacci 61.8% | 1.3357 |
| Daily Pivot Point S1 | 1.3289 |
| Daily Pivot Point S2 | 1.3227 |
| Daily Pivot Point S3 | 1.317 |
| Daily Pivot Point R1 | 1.3408 |
| Daily Pivot Point R2 | 1.3465 |
| Daily Pivot Point R3 | 1.3527 |
Reprinted from fxtsreet , the copyrights all reserved by the original author.
Disclaimer: The content above represents only the views of the author or guest. It does not represent any views or positions of FOLLOWME and does not mean that FOLLOWME agrees with its statement or description, nor does it constitute any investment advice. For all actions taken by visitors based on information provided by the FOLLOWME community, the community does not assume any form of liability unless otherwise expressly promised in writing.
FOLLOWME Trading Community Website: https://www.followme.com


Hot
No comment on record. Start new comment.