Gold Price Analysis: Refreshes session tops, seems poised to climb further

- Gold attracted some dip-buying near the $1930 area and refreshed session tops in the last hour.
- The intraday technical set-up supports prospects for an extension of the intraday positive move.
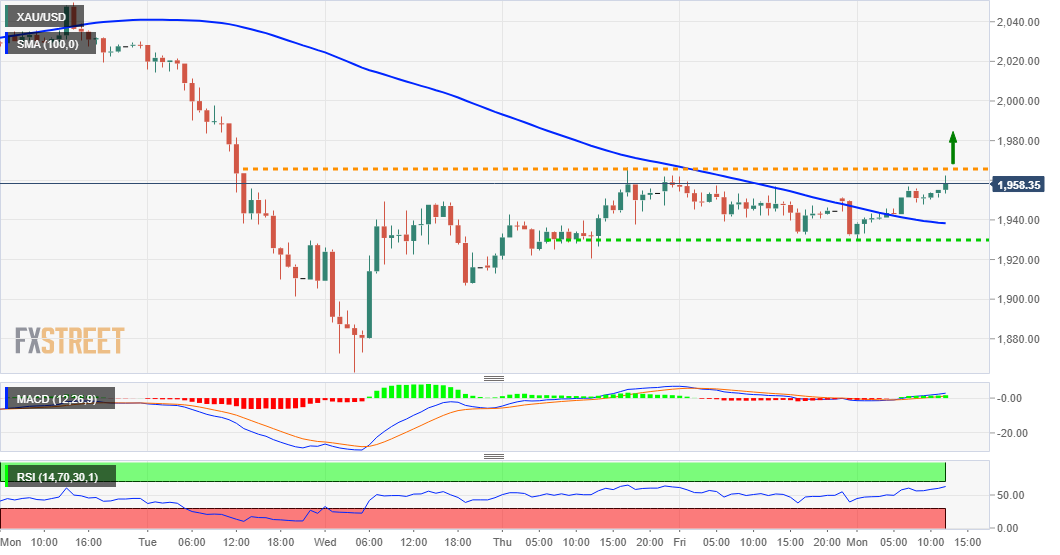
Gold built on its steady intraday positive move and climbed to fresh daily tops, around the $1960-62 region during the early North American session. The prevalent selling bias around the USD extended some support to the dollar-denominated commodity. Adding to this, a sustained move back above 100-hour SMA was also seen as a key trigger for intraday bullish traders.
Meanwhile, technical indicators on the daily chart maintained their bullish bias and have been gaining positive traction on the 1-hourly chart. The set-up supports prospects for an extension of the intraday positive move. Hence, a subsequent positive move beyond the $1966 intermediate hurdle, en-route the next major hurdle near the $1980 horizontal zone, looks a distinct possibility. However, the upbeat market mood warrants some caution for bulls.
On the flip side, the $1945 level now seems to protect the immediate downside. This is followed by support near the daily swing lows, around the $1930-29 region, which if broken decisively will negate any near-term positive bias. The commodity might then accelerate the fall towards the $1907 intermediate support before eventually dropping below the key $1900 round-figure mark. Bears might then aim to retest last week's swing low, around the $1863-62 region.
Gold 1-hourly chart
Technical levels to watch
XAU/USD
| OVERVIEW | |
|---|---|
| Today last price | 1961.28 |
| Today Daily Change | 16.68 |
| Today Daily Change % | 0.86 |
| Today daily open | 1944.6 |
| TRENDS | |
|---|---|
| Daily SMA20 | 1950.58 |
| Daily SMA50 | 1839.68 |
| Daily SMA100 | 1768.58 |
| Daily SMA200 | 1654.32 |
| LEVELS | |
|---|---|
| Previous Daily High | 1962.3 |
| Previous Daily Low | 1932.46 |
| Previous Weekly High | 2049.96 |
| Previous Weekly Low | 1863.24 |
| Previous Monthly High | 1984.8 |
| Previous Monthly Low | 1757.7 |
| Daily Fibonacci 38.2% | 1943.86 |
| Daily Fibonacci 61.8% | 1950.9 |
| Daily Pivot Point S1 | 1930.61 |
| Daily Pivot Point S2 | 1916.61 |
| Daily Pivot Point S3 | 1900.77 |
| Daily Pivot Point R1 | 1960.45 |
| Daily Pivot Point R2 | 1976.29 |
| Daily Pivot Point R3 | 1990.29 |
Reprinted from fxstreet , the copyrights all reserved by the original author.
Disclaimer: The content above represents only the views of the author or guest. It does not represent any views or positions of FOLLOWME and does not mean that FOLLOWME agrees with its statement or description, nor does it constitute any investment advice. For all actions taken by visitors based on information provided by the FOLLOWME community, the community does not assume any form of liability unless otherwise expressly promised in writing.
FOLLOWME Trading Community Website: https://www.followme.com


Hot
No comment on record. Start new comment.