Daily Market Report - 7th July 2020


$50 Free Margin Account Campaign: https://www.nooralmal.com/cc19...
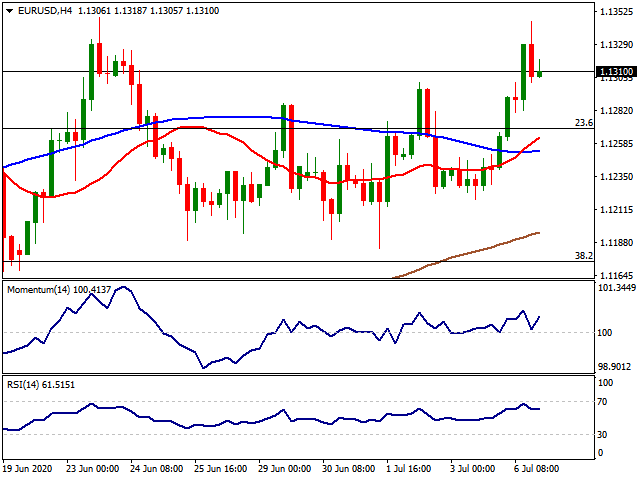
EURUSD
The EUR/USD pair has reached an intraday high of 1.1345, its highest since mid-June, easing towards the 1.1300 region during US trading hours. A rally in Asian equities was the main market driver throughout the first half of the day, amid optimism over an economic comeback among Chinese authorities. The EUR/USD pair advanced, despite discouraging EU data. German Retail Sales plunged by 29.3% YoY in May. The EU sales in the same period, however, declined by 5.1% YoY, better than anticipated. The Union also released the July Sentix Investor Confidence, which came in at -18.2 vs. the -10.9 expected.
The dollar managed to recover some ground on a positive US ISM Non-Manufacturing PMI, which jumped to 57.1 in June from 45.4 in the previous month, largely surpassing the market’s expectations. The Markit Services PMI for the same period was upwardly revised to 47.9 from a preliminary estimate of 46.7. Wall Street eased from intraday highs but closed with substantial gains.
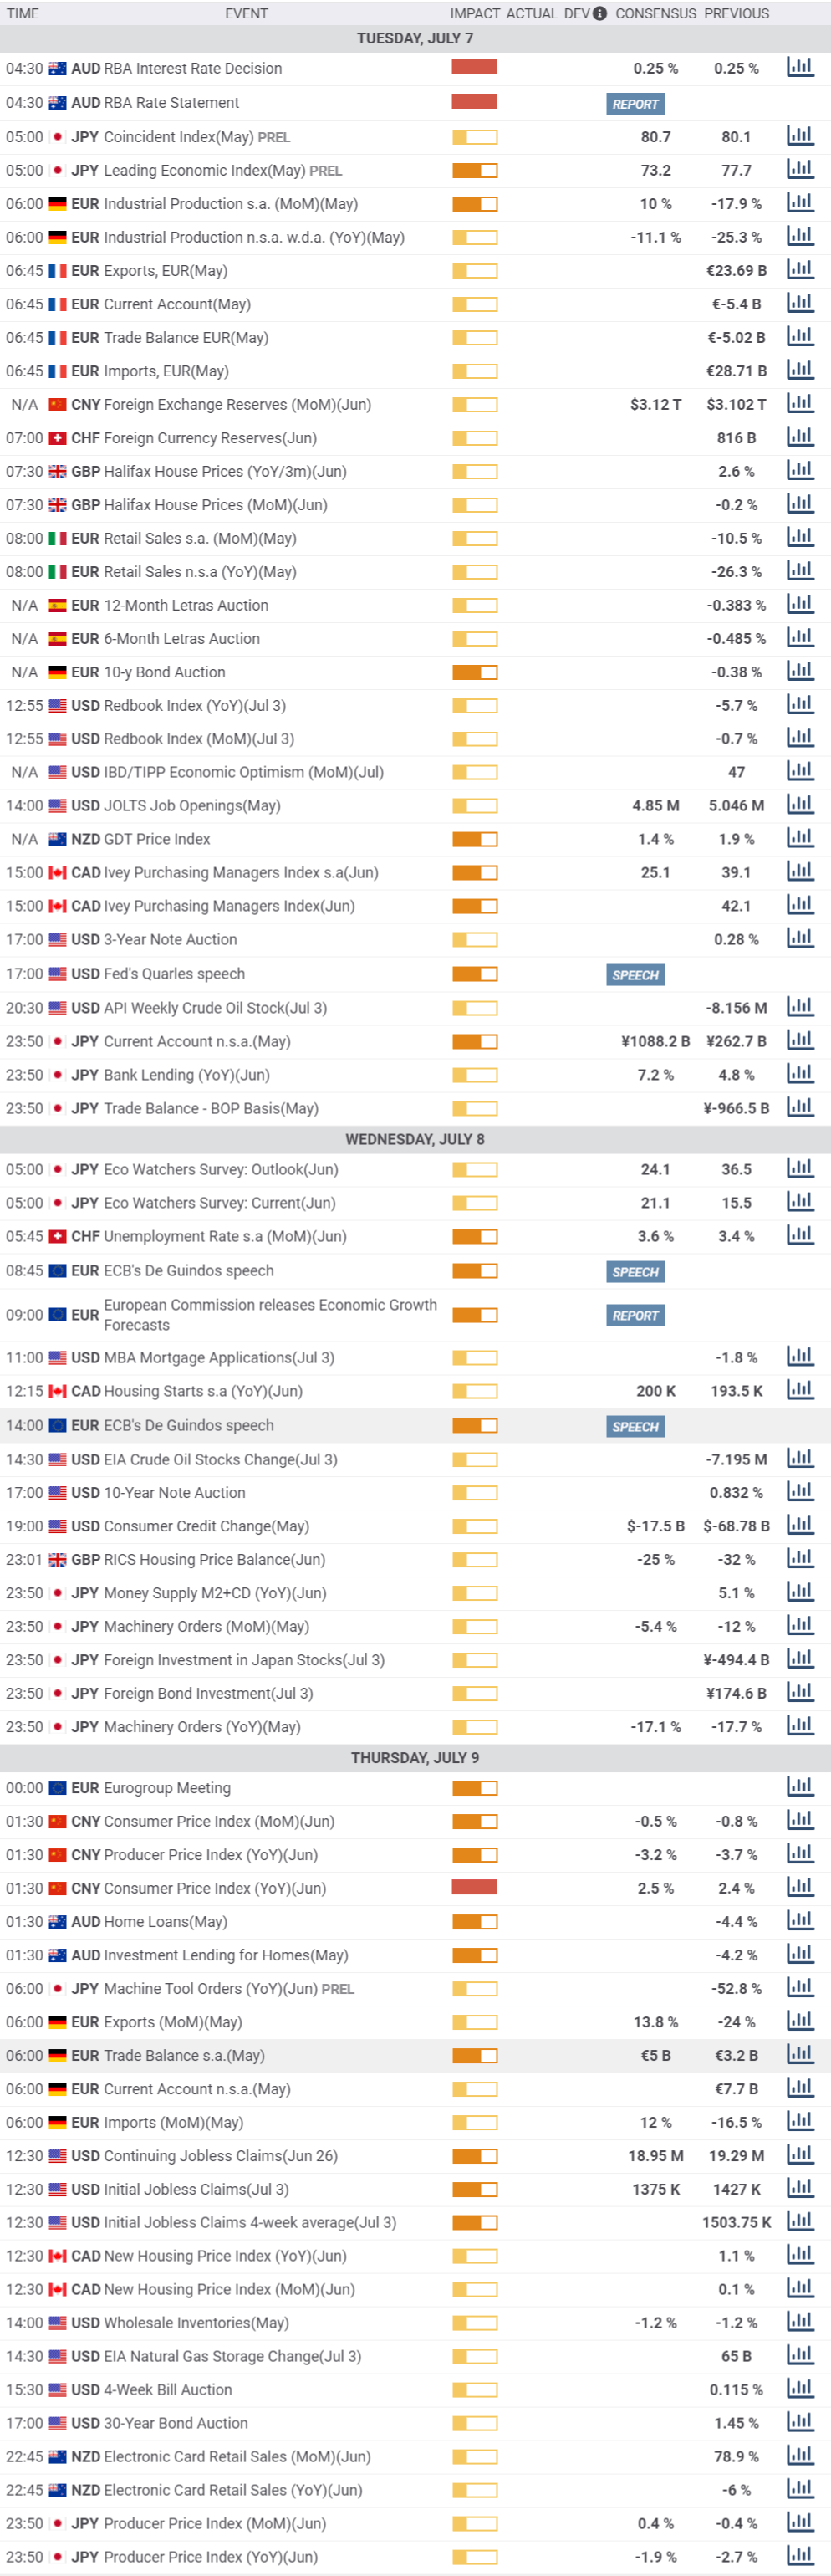
Meanwhile, the number of coronavirus cases remains in the eye of the storm. After reporting over 55,000 new cases in one day last week, new contagions have been decreasing in the US, although they remain above 40,000 per day. On Tuesday, Germany will publish May Industrial Production, see up by 10% in the month, while the US will only release minor figures, the IBD/TIPP Economic Optimism for July and JOLTS Job Openings for May.
The EUR/USD pair has retreated from the upper end of its latest range, as it briefly surpassed the 1.1330 price zone. Nevertheless, it’s holing above a Fibonacci level at 1.1270, which maintains the risk skewed to the upside. The pair retains its bullish potential in the short-term, and the 4-hour chart shows that the pair is comfortable above all of its moving averages, and with the 20 SMA crossing above the 100 SMA. Technical indicators, in the meantime, remain within positive levels. A break below 1.1270 should put the pair back into neutral ground and diminish the chances of a bullish extension.
Support levels: 1.1270 1.1220 1.1170
Resistance levels: 1.1345 1.1390 1.1425
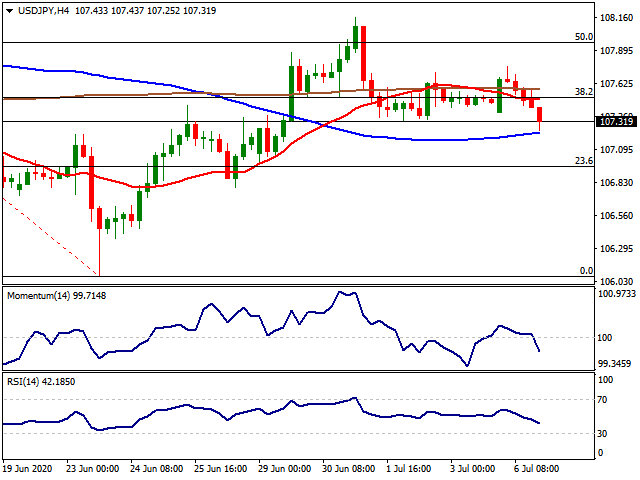
USDJPY
The USD/JPY pair surged to a daily high of 107.76 during the Asian session amid risk-appetite taking over the financial world. Asian indexes posted substantial gains, led by Chinese optimism on an economic comeback, which later extended into European and American markets. Broad dollar’s weakness, however, pushed the pair lower in the last trading session of the day, with the pair piercing the bottom of its latest range and ending the day in the 107.30 price zone.
US Treasury yields advanced intraday on the back of upbeat local data, but trimmed gains ahead of the close, adding pressure on the pair. During the upcoming Asian session, Japan will publish the preliminary estimate of the May Leading Economic Index, foreseen at 73.2 from 77.7 in the previous month. The country will also publish the Coincident Index for the same month, seen at 80.7 from 80.1 previously.
The USD/JPY pair is at risk of falling further, as the pair has finally moved away from the 38.2% retracement of its latest daily decline. In the 4-hour chart, it’s barely holding above a flat 100 SMA, and below the 20 and 200 SMA, while technical indicators head firmly lower within negative levels. The bearish case will be firmer if the pair losses 106.95, the next Fibonacci support level.
Support levels: 107.20 106.95 106.60
Resistance levels: 107.50 107.95 108.30
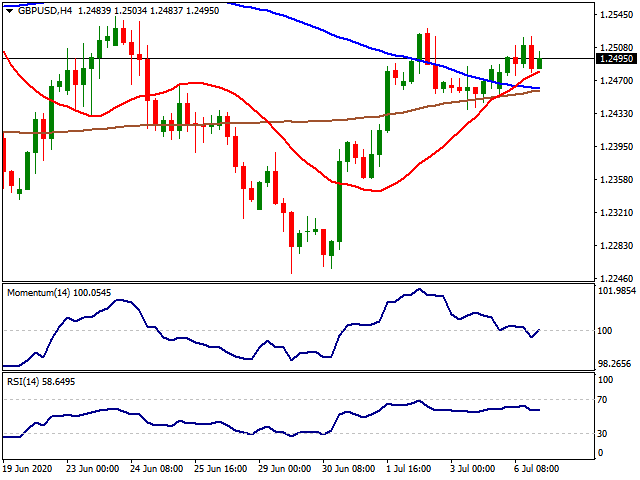
GBPUSD
The GBP/USD pair saw little action this Monday, trading within a limited intraday range and settling at around 1.2465. The Pound found short-term support in the UK Markit Construction PMI, as the June reading resulted in 55.3, beating expectations of 47 and well above the previous 28.9. The pair retreated following upbeat US data related to services output. Meanwhile, the EU’s chief negotiator Michel Barnier arrived in London for another round of face-to-face talks. The UK will publish this Tuesday the Halifax House Price Index for June, previously at -0.2%.
The GBP/USD pair keeps consolidating around the 1.2500 figure, with the bearish potential still limited. In the 4-hour chart, the pair holds above its moving averages, all of them confined to a tight 20 pips’ range. Technical indicators, in the meantime, continue to hover directionless around their midlines. The fact that the pair was unable to break higher, despite the broad dollar’s weakness, somehow anticipates a downward move ahead, mainly on a break below 1.2440, the immediate support.
Support levels: 1.2440 1.2400 1.2360
Resistance levels: 1.2520 1.2560 1.2600
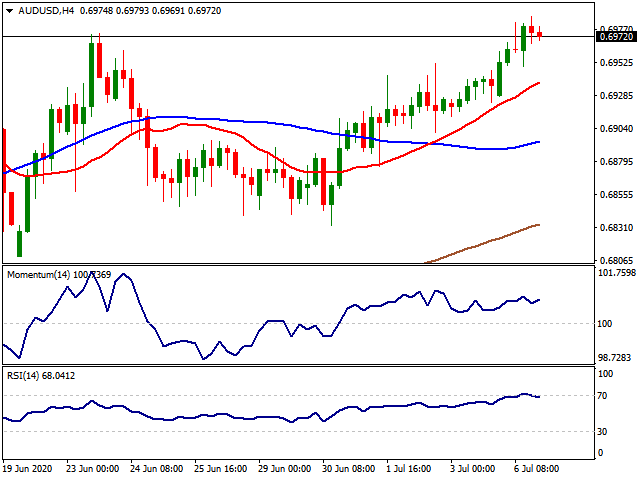
AUDUSD
The AUD/USD pair traded as high as 0.6987, finding support in an improved market’s mood that sent global equities higher. Also, Australian data published at the beginning of the day underpinned the Aussie, as the TD Securities Inflation report for May resulted at 0.6% MoM, better than the previous -1.2%. When compared to a year earlier, inflation picked up from 0.1% to 0.7% according to the same estimate.
During the upcoming Asian session, the Reserve Bank of Australia will have a monetary policy meeting. The central bank is widely anticipated to keep its current monetary policy unchanged, as policymakers have been cautiously optimistic over the economy’s performance within the pandemic context. The cash rate is at a record low of 0.25%.
The AUD/USD pair is poised to challenge its 2020 high at 0.7063, offering a short-term neutral-to bullish stance. The 4-hour chart shows that a bullish 20 SMA keeps leading the way higher below the current level, and widening the distance with the larger ones. Technical indicators in the mentioned time-frame remain within positive levels, although lacking directional strength.
Support levels: 0.6930 0.6895 0.6850
Resistance levels: 0.6990 0.7015 0.7060
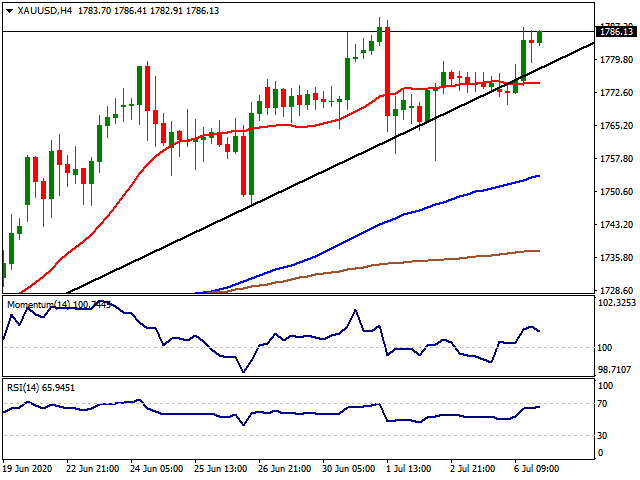
GOLD
Gold found extra support on the first trading of the week with the retracement seen in the USD index DXY. DXY slid below the 97.00 level while the yellow metal tested it’s eight-year high once again. Despite the positive mood seen by the US Treasury Bond Yields, the USD lost its appeal despite better than expected ISM Non-Manufacturing data in the US. At this point, the increase in the coronavirus cases and better than expected macro-data sets from the main economies are balancing the risk appetite in the market.
In terms of technical levels, over the 1.765$ (May 2020 peak), the resistances might be followed at 1.785$ (2012 multi-time peak), 1.800$ and 1.822$ levels. Below the 1.765$, the supports can be followed at 1.750$(December 2012 peak), 1.738$ (April double top) and 1.700$.
Support Levels: 1.750$ 1.738$ 1.700$
Resistance Levels: 1.785$ 1.800$ 1.822$
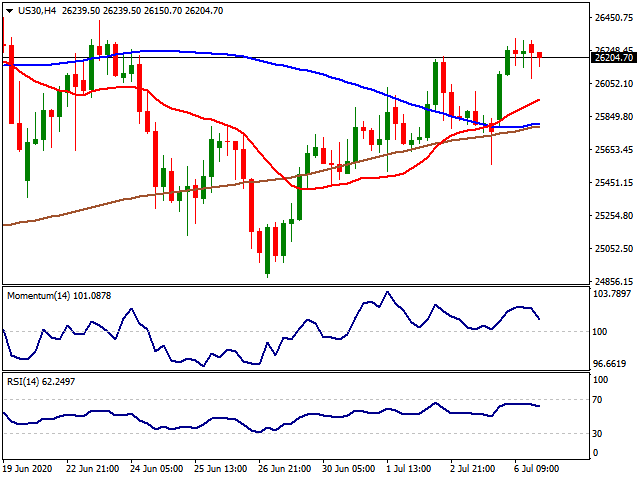
DOW JONES
Global markets decided to ignore the incline seen in the number of new cases, especially in the US and rallied both in China, the EU and the US. On the other hand, despite the positive market mood, Gold kept its positive look too along with the decline in the USD. The data released today in the US signalled that the worst might be over for the US economy. Data released on Monday showed better-than-expected numbers from the service sector. Though the survey came before the recent jump in virus case counts, the non-manufacturing index signalled a sharp rebound in June. The ISM non-manufacturing index rose to 57.1 in June—a much larger rise than had been expected—bringing the index close to where it was before the crisis. While the survey was conducted before the latest flare-up in case counts, the service sector was coming back online in a remarkable fashion. While the whole world focused on the coronavirus pandemic, the election in the US might take the stage soon as Biden is widening the gap against Trump.
In case of breach of 26.000 level, Dow Jones can target 25.667 and 24.343 on the downside. On the other hand, resistances might be followed at 26.569, 27.000 and 27.398.
Support Levels: 26.000 25.667 24.343
Resistance Levels: 26.569 27.000 27.298
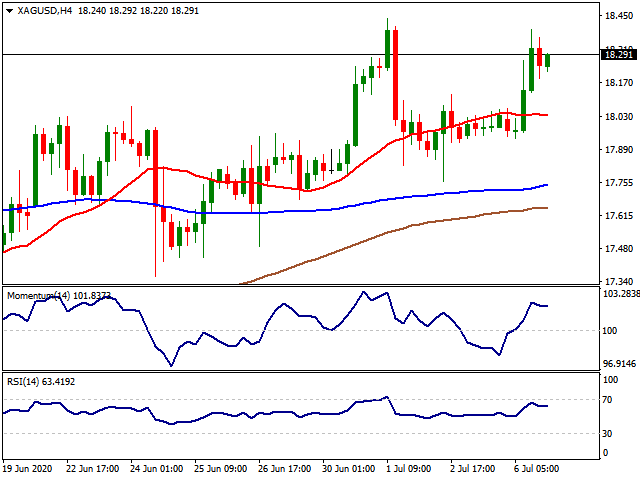
XAAAGAGGA
Silver had a positive start of the week supported by the retracement seen in the USD and better macro-data readings signalling a normalisation in the industrial production. However, the move-up was once again capped around 18.38$ which was tested a couple of times since early June. Despite the rally seen in Wall Street, in general, precious metals are still finding strong demand as the traders are willing to secure themself for a possible stocks sell-off which might be caused by the second wave of the pandemic.
As 16.97$ (%50.0 14.29$-19.65$) stands as critical support, below this level, a test of 16.33$ (%61.8 14.29$-19.65$) and 15.55$ (%76.40 14.29$-19.65$) can be targeted. On the top side, over the 17.60$ (%38.20 14.29$-19.65$) resistance, 18.38$ (%23.6 14.29$-19.65$), 18.90$ (January and February peak zone) and 19.67$ (2019 peak) can be followed as targets up.
Support Levels: 16.97$ 16.33$ 15.55$
Resistance Levels: 18.38$ 18.70$ 18.90$
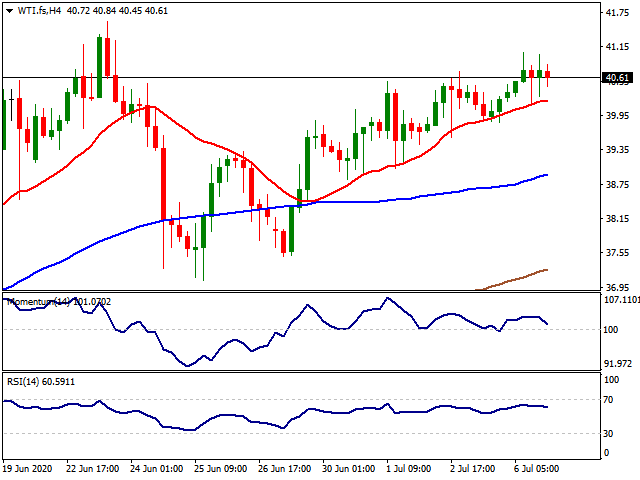
WITITI
WTI had a positive Monday trading supported by the decline in the USD and rising risk appetite with the tightening of supplies. The prices derive support from tighter global oil supplies, in light of last week’s draw in the US crude inventories and falling OPEC output levels. The OPEC’s oil production fell to its lowest in decades, as its members adhere to the OPEC+ oil output cuts deal for the third straight month in July. On the other hand, news from Kuwait limited the gains in oil prices as Kuwait’s Oil Ministry’s comments that oil production resumed early July at the Wafra oilfield. The oil is co-owned by Kuwait and Saudi Arabia and the production restarted after a five-year halt. The move carried WTI once again through 41.00$ level but the black gold retraced and ended the day at 40.60$ level.
A decisive move over 32.81$ (65.62$-0.00$ %50) might carry WTI to 40.56$ (65.62$-0.00$ %61.80), 50.00$ and 54.00 levels. Below the 32.81$ level, 31.00$, 27.40$ (9th of March dip) and 26.00$ levels can be targeted.
Support Levels: 31.00$ 27.40$ 26.00$
Resistance Levels: 40.56$ 50.00$ 54.00$
MACROECONOMIC EVENTS
* All the Moving Average support and resistance levels are dynamic by nature. Means when the price approaches the Moving averages, slight variation occurs in the forecasted Moving Average support and resistance levels. Previous few days’ intraday levels are also signicant while trading the current day as the price tend to hover around these levels for some time. Levels in red indicate strong, critical or vital.
Please remember that trading financial markets carry a high degree of risk to your capital. It is possible to lose more than your initial stake. Leveraged products may not be suitable for all investors, therefore please ensure you fully understand the risks involved and seek independent advice if necessary.
All Rights Reserved © Noor Al Mal
#交易商资讯##外汇市场影响因素##外汇资讯##黄金创6年新高##黄金突破1550$#
Edited 07 Jul 2020, 11:41
Disclaimer: The content above represents only the views of the author or guest. It does not represent any views or positions of FOLLOWME and does not mean that FOLLOWME agrees with its statement or description, nor does it constitute any investment advice. For all actions taken by visitors based on information provided by the FOLLOWME community, the community does not assume any form of liability unless otherwise expressly promised in writing.
FOLLOWME Trading Community Website: https://www.followme.com


Hot
No comment on record. Start new comment.