Indicator of trend turns – KDJ:

KDJ is software instrument which help traders to determine the reversals of market tendency. Indicator belongs to trend technical instruments group. Therefore, users should trade with KDJ during high volatility.

How to enable and configure KDJ: procedure
Trader needs to perform following actions to start working with indicator on IQ Option platform:
-
open technical indicators menu by clicking on corresponding icon;
-
select KDJ from list.

Indicator settings window is divided into two tabs: basic settings and visual parameters (colours and display).
-
Basic settings. User can change KDJ analyser numerical variables in this tab, i.e values of moving curves periods and setting of overbought/oversold levels.
-
Line (dK) is a fast SMA with period of 9.
-
Line (dD) is a slow signal curve with period of 3.
-
Pulse line (J) is SMA, obtained after smoothing a curve dK with period 3.
-
Top line (overbought) is a delimitation element of critical zone in which market is overbought.
-
Bottom line (oversold) is a delimitation line of area in which market is oversold.
-

-
Colour and display options. Trader can set convenient visual settings (colour, size) of indicator lines; enable/disable each individual element in this tab.

KDJ settings differ. It is depending on which timeframe and/or trade way trader has select. But the user who first launched the indicator in IQ Option broker trade room is advised to leave the indicator numerical variables by default, and to test the instrument on demo account.
What signals an indicator generates
KDJ is an improved Stochastic Oscillator, which also operates in underground of trade room with a scale (0 – 100). Technical instrument KDJ consists of three moving averages (SMA) with different periods. This distinguishes it from STOCH. The third curve J is intended to determine the strength of existing trend: the larger the distance SMA (J) from remaining indicator lines, the stronger a tendency.

Trader can recognize the following market signals, when he will working with KDJ instrument:
-
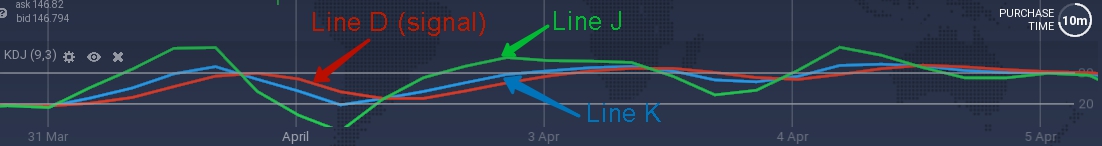
Signals (buy/sell) from the indicator lines is an impulse that is formed as a result of passing through a signal curve D (in this case: a red line) two fast SMA (blue curve – K, smoothed green line – J).
Trader needs to buy, when a blue line and green curve have passed through red SMA from bottom to top and continue to move, since this means that tendency is now bullish tendency.
Trader should open short positions for sale when fast lines crossed a signal curve from top to bottom, since market is now bearish.

Sequence of lines with a falling tendency (when user looks at chart from top to bottom) should be as follows: red D → blue K → green J. If price is growing, the sequence of curves will be opposite: green J → blue K → red D.
-
Signal (flat). Market participant can interpret the signal of lateral market movement, when all lines of indicator are intertwined with each other. User should refrain from any deals or to apply other technical analysis instruments during this state of the market.

-
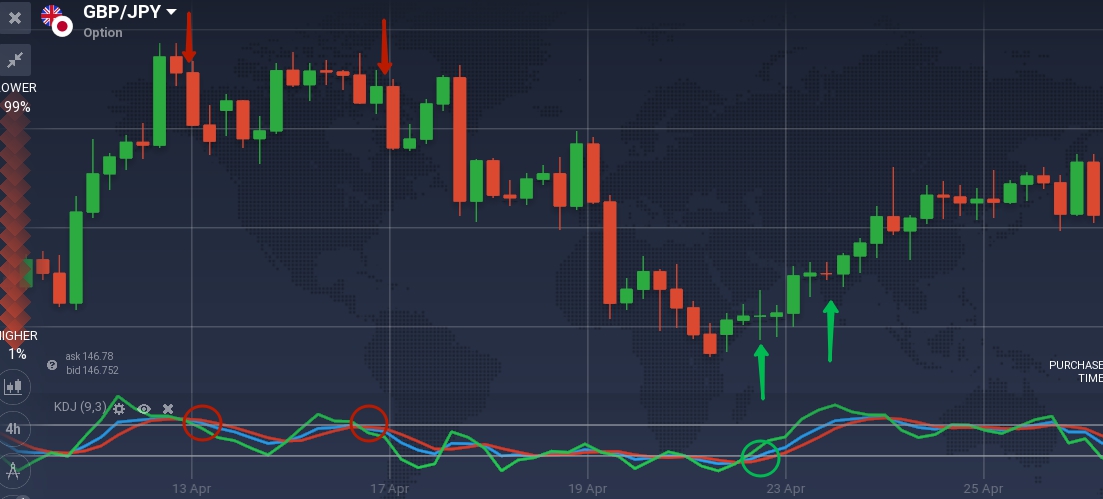
Signals for trading operations from oversold/overbought levels are formed if indicator lines cross the upper or lower critical zones in opposite direction. In other words, when curves that are in one of overbought areas (above 80) or oversold (below 20) to come out from these zones. Signals for trader to make deals are the places of reverse crossing of one or another level.
The output of SMA lines from oversold zone is a buy signal, and from overbought area is an impulse for selling.
Summary
Technical instrument KDJ is a multifunctional indicator of market tendencies reversal. It is perfectly adapted to any markets and timeframes. When using a KDJ the trader can to:
-
obtain accurate signals for deals both as with help of oversold/overbought levels and with help interaction of SMA lines;
-
identify a tendency strength;
-
identify a lateral market movement.
Although KDJ is similar to many traders of Stochastic Oscillator, this instrument needs to be tested. Just for such purposes on site of broker IQ Option there is a free account. User of platform can safely try out a new indicator or trade strategy thanks this function which.
NOTE: This article is not an investment advice. Any references to historical price movements or levels is informational and based on external analysis and we do not warranty that any such movements or levels are likely to reoccur in the future
Disclaimer: The content above represents only the views of the author or guest. It does not represent any views or positions of FOLLOWME and does not mean that FOLLOWME agrees with its statement or description, nor does it constitute any investment advice. For all actions taken by visitors based on information provided by the FOLLOWME community, the community does not assume any form of liability unless otherwise expressly promised in writing.
FOLLOWME Trading Community Website: https://www.followme.com


Hot
-THE END-