Analisis Tren
Minggu ini, dari level 1,3450 (dekat dengan candle mingguan terakhir), harga mungkin mulai bergerak turun menuju 1,3270 – level support historis (garis putus-putus biru). Setelah menguji level ini, harga mungkin terus bergerak turun menuju 1,3141 – level retracement 38,2% (garis putus-putus merah).
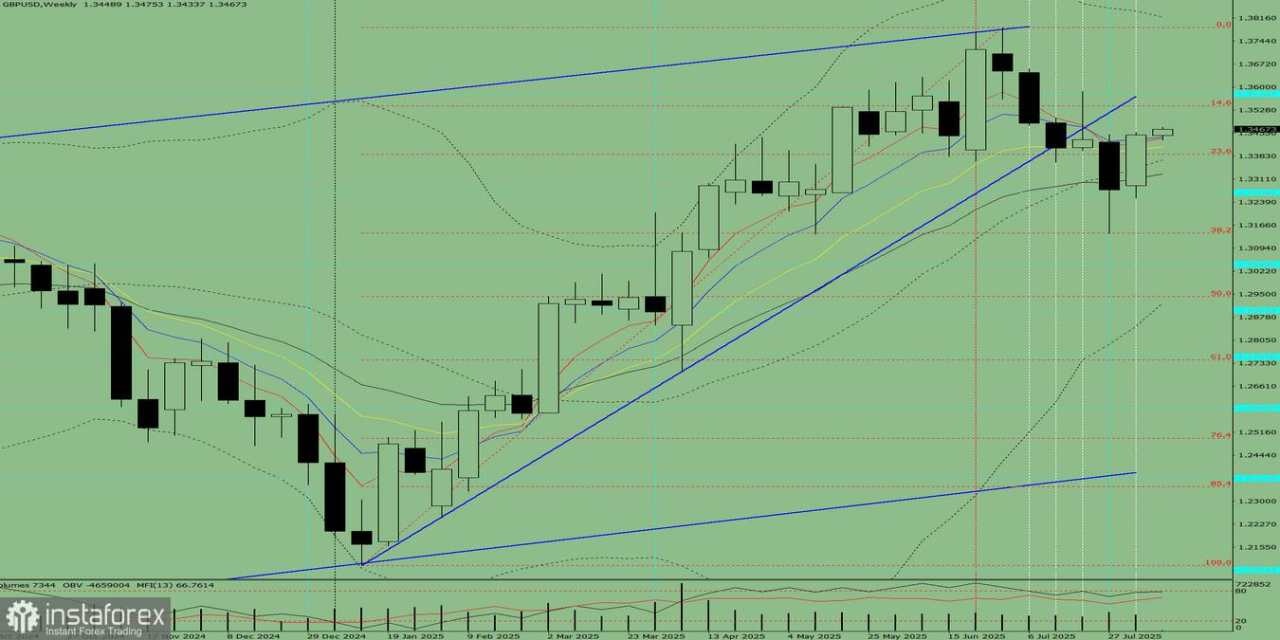
Gambar 1 (Grafik Mingguan).
Analisis Keseluruhan:
- Analisis indikator – turun
- Level Fibonacci – turun
- Volume – turun
- Analisis candlestick – turun
- Analisis tren – turun
- Bollinger Bands – turun
- Grafik bulanan – turun
Kesimpulan dari analisis komprehensif: pergerakan menurun.
Perkiraan keseluruhan untuk candle mingguan GBP/USD: harga kemungkinan besar akan mempertahankan tren bearish selama minggu ini, tanpa bayangan atas pada candle hitam mingguan (Senin – pergerakan turun) dan bayangan bawah (Jumat – pergerakan naik).
Skenario alternatif: dari level 1,3450 (penutupan candle mingguan terakhir), harga mungkin mulai bergerak turun menuju 1,3270 – level support historis (garis putus-putus biru). Setelah mencapai level ini, harga mungkin kemudian bergerak naik menuju 1,3313 – EMA periode 21 (garis hitam tipis).

Leave Your Message Now