Analisis Tren (Gbr. 1)
Pada hari Kamis, pasar mungkin akan terus bergerak turun dari 1,0886 (penutupan harian kemarin) menuju 1,0861 – level retracement Fibonacci 14,6% (garis putus-putus biru). Dari level ini, kemungkinan terbentuk pantulan ke atas menuju 1,0897 – fraktal atas (garis putus-putus biru).
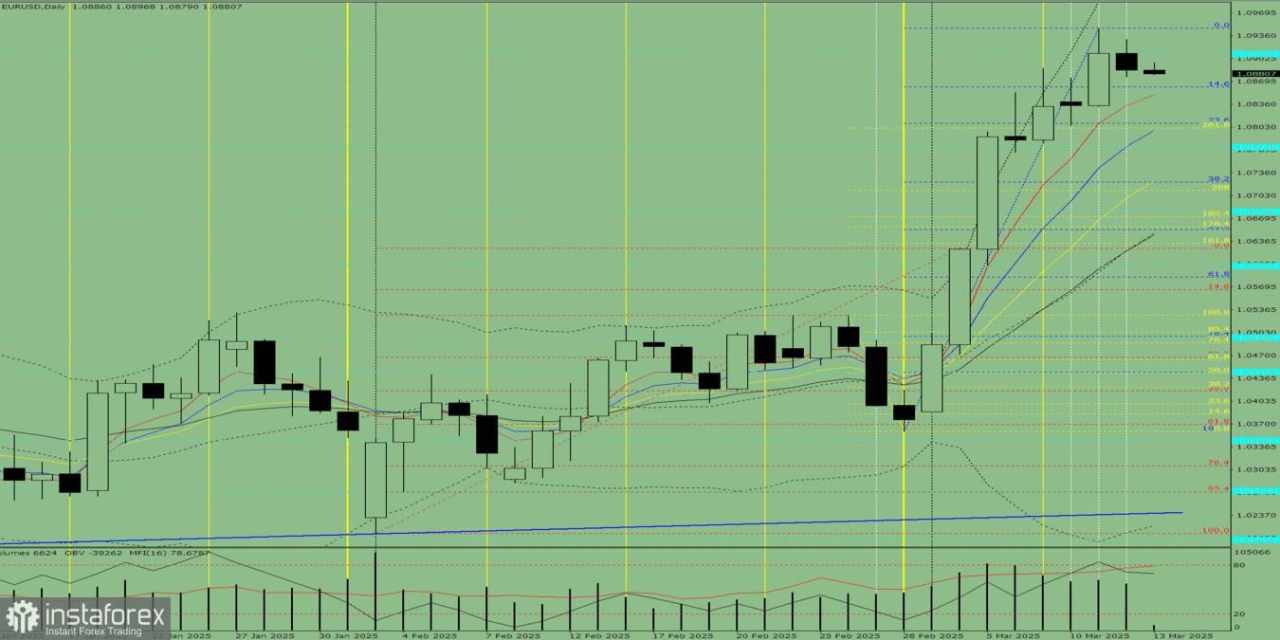
Gambar 1 (Grafik Harian)
Analisis Komprehensif:
- Analisis Indikator – Menurun
- Level Fibonacci – Menurun
- Volume – Menurun
- Analisis Candlestick – Menurun
- Analisis Tren – Naik
- Bollinger Bands – Naik
- Grafik Mingguan – Menurun
Kesimpulan: Pergerakan Diperkirakan Bearish
Skenario Alternatif:
Pada hari Kamis, pasar mungkin terus menurun dari 1,0886 (penutupan harian kemarin) menuju 1,0808 – level retracement Fibonacci 23,6% (garis putus-putus biru). Dari level ini, harga mungkin berbalik naik menuju 1,0861 – level retracement Fibonacci 14,6% (garis putus-putus biru).

Leave Your Message Now