In the world of technical analysis, chart patterns are more than just lines—they represent the evolution of market sentiment and the battle between buyers and sellers. Autochartist identified an Ascending Triangle on the gold 60-minute chart earlier today, offering traders a potential opportunity worth watching.
What Is an Ascending Triangle?
The ascending triangle is a classic bullish pattern characterized by two key lines:
- Horizontal resistance line: Price repeatedly touches the same high, forming a flat top.
- Rising trendline: Higher lows are established, showing that buying pressure is increasing.
As these lines converge, the market builds energy near resistance. A breakout above the resistance line often signals the start of a new upward move.
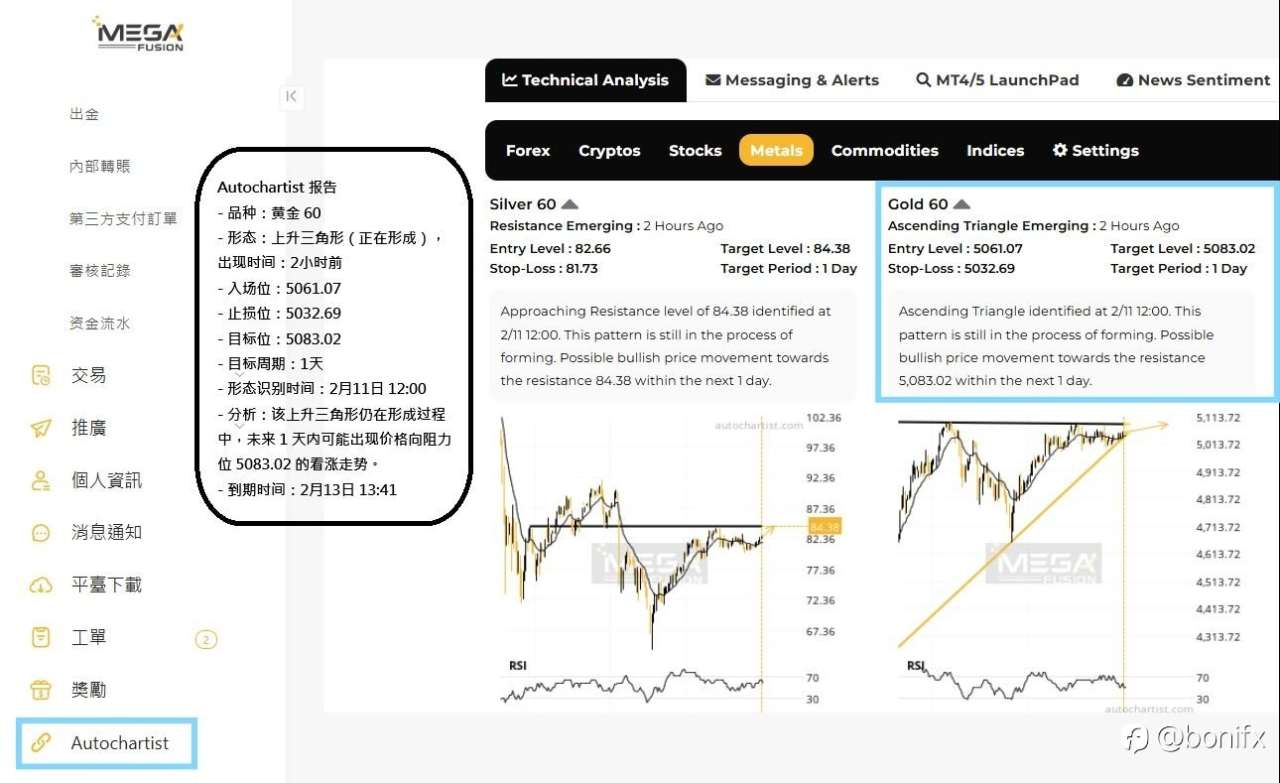
Signals from Autochartist on the Gold 60-Minute Chart
According to Autochartist’s analysis:
- Entry Level: 5061.07
- Stop-Loss: 5032.69
- Target Level: 5083.02
- Target Period: 1 day
- Pattern Identified: February 11, 12:00
- Expiry: February 13, 13:41
This suggests that within the next 24 hours, gold may attempt to push toward the resistance level of 5083.02.
Trading Logic
- Entry Strategy: Consider entering when price breaks above resistance, or after a breakout confirmation with a retest.
- Risk Control: Place stop-loss below the rising trendline (5032.69) to protect against false breakouts.
- Profit Target: Aim for 5083.02, consistent with the projected breakout move.
- Time Window: The pattern remains valid until February 13, 13:41, highlighting the importance of timing.

Psychological Insight
The ascending triangle reflects market psychology:
- Buyers steadily raise the floor, showing growing confidence.
- Sellers defend resistance, but their strength weakens over time.
- A breakout often comes with increased volume, symbolizing a surge in market conviction.
The ascending triangle on the gold 60-minute chart, as identified by Autochartist, presents a short-term bullish opportunity. Whether you are a day trader or swing trader, this pattern deserves attention. Still, remember that technical analysis is not infallible—risk management remains the cornerstone of successful trading.
Disclaimer: The views expressed are solely those of the author and do not represent the official position of Followme. Followme does not take responsibility for the accuracy, completeness, or reliability of the information provided and is not liable for any actions taken based on the content, unless explicitly stated in writing.

-THE END-