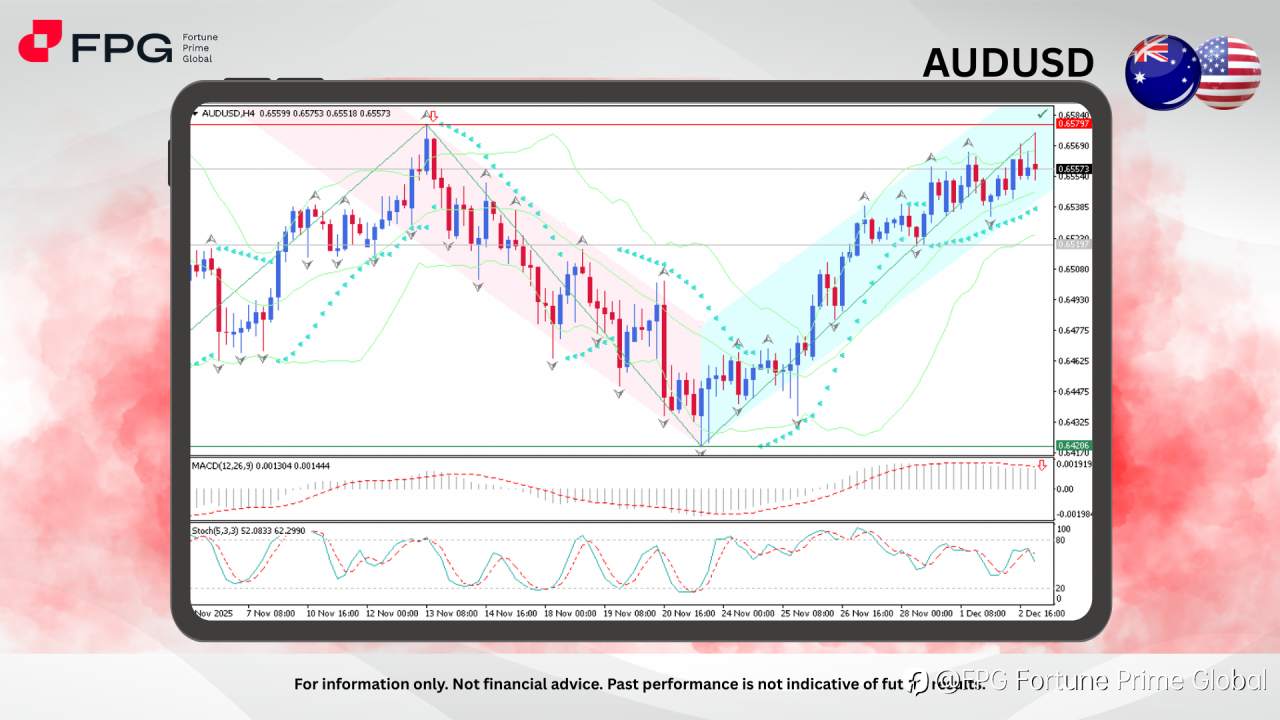
AUDUSD continues to extend its bullish recovery after bouncing strongly from the 0.6420 demand zone, forming a clear V-shape rebound and currently moving firmly within its ascending channel. The pair is now trading around 0.6557 and approaching the key 0.6580 resistance level, where historical reactions suggest a price rejection is likely to occur. Although the broader bias remains bullish, the pair is pressing into a critical supply area, signaling that the market is entering an inflection zone between continuation and potential corrective rotation.
Price action shows a clear sequence of higher highs and higher lows since 25 November, supported by bullish channel structure and consistent stability above the mid-Bollinger band. Candle bodies have started to compress as price approaches the channel’s upper boundary, reflecting reduced directional conviction.
Momentum indicators show early signs of fatigue: the MACD histogram is contracting toward the signal line, indicating fading upward strength, while the Stochastic Oscillator (5,3,3) sits in the mid-zone (52–62), suggesting a transition phase where either continuation or rotation may occur. While the structural trend remains bullish, short-term pressure near resistance could generate a corrective pullback.
Market Observation & Strategy Advice
1. Current Position: AUDUSD is currently trading around 0.6557, consolidating under a major supply level while maintaining its broader bullish structure, indicating a moment of equilibrium between buyers and sellers.
2. Resistance Zone: Key resistance stands at 0.6580, aligning with the previous price congestion. A breakout and sustained hold above this level could open a path toward 0.6625 and potentially 0.6670.
3. Support Zone: Immediate support sits at 0.6519. Stronger support lies near 0.6420, a demand zone that previously triggered significant bullish reactions.
4. Indicators: Stochastic Oscillator is in a mid-neutral zone, hinting at possible directional shift depending on how price reacts to resistance. MACD shows slowing momentum through histogram contraction, signaling early weakening of bullish pressure. Bollinger Bands remain moderately expanded, suggesting the trend is still active but losing acceleration.
5. Trading Strategy Suggestions:
- Rotational Buy Setup: Consider buying dips near 0.6519–0.6530 if bullish rejection forms, targeting 0.6575 and 0.6620.
- Resistance Fade Play: Look for short-term sells around 0.6580 if repeated rejections occur, aiming for 0.6535 as corrective target.
- Momentum Breakout Strategy: Buy only after a confirmed H4 close above 0.6580, targeting 0.6625 and 0.6670 with tight risk control below 0.6550.
Market Performance:
Forex Last Price % Change
EUR/USD 1.1634 +0.10%
USD/JPY 155.66 −0.12%
Today’s Key Economic Calendar:
AU: Ai Group Industry Index
AU: GDP Growth Rate QoQ
US: MBA 30-Year Mortgage Rate
US: ADP Employment Change
EU: ECB President Lagarde Speech
US: Export Prices MoM & YoY
US: Industrial Production MoM
US: ISM Services PMI
US: EIA Crude Oil & Gasoline Stocks Change
Risk Disclaimer: This report is for informational purposes only and does not constitute financial advice. Investments involve risks, and past performance does not guarantee future results. Consult your financial advisor for personalized investment strategies.
Edited 03 Dec 2025, 11:40
Disclaimer: The views expressed are solely those of the author and do not represent the official position of Followme. Followme does not take responsibility for the accuracy, completeness, or reliability of the information provided and is not liable for any actions taken based on the content, unless explicitly stated in writing.


Leave Your Message Now