Many beginners get trapped by relying only on instinct or blindly following signals without any analytical basis. In reality, market price movements are driven by patterns, momentum, and tendencies that can be studied.
Consistent traders usually depend on technical indicators to read market direction, measure trend strength, and identify logical entry and exit points.
On Followme, all popular indicators such as MACD, RSI, Bollinger Bands, and Moving Average (MA) can be added to your chart with just one click.
The difference compared to other platforms is that on Followme, you can also see and discuss how other traders use the same indicators. This makes learning more interactive and realistic not just theory.
1. MACD (Moving Average Convergence Divergence)
What it’s for:
Measures trend strength (bullish or bearish)
Identifies momentum (whether a trend is strengthening or weakening)
Generates entry/exit signals through line crossovers or histogram movements
How to Read It:
- Long red histogram bars pointing downward → indicates a strong bearish trend; selling momentum dominates.
- Histogram starts to shrink and turns green → shows that selling pressure is weakening; possible reversal signal (price may bounce upward).
- Two lines (blue & orange):
- Blue line (MACD Line) = difference between EMA 12 and EMA 26
- Orange line (Signal Line) = a 9-period moving average of the blue line
- When the blue line crosses above the orange line → bullish signal
- When the blue line crosses below the orange line → bearish signal
💡 How to Use It on Followme:
Click on the MACD option in the indicator menu, and an additional chart will appear below the main price graph.
You can instantly check whether the XAU/USD trend is losing momentum or getting ready for another upward move.
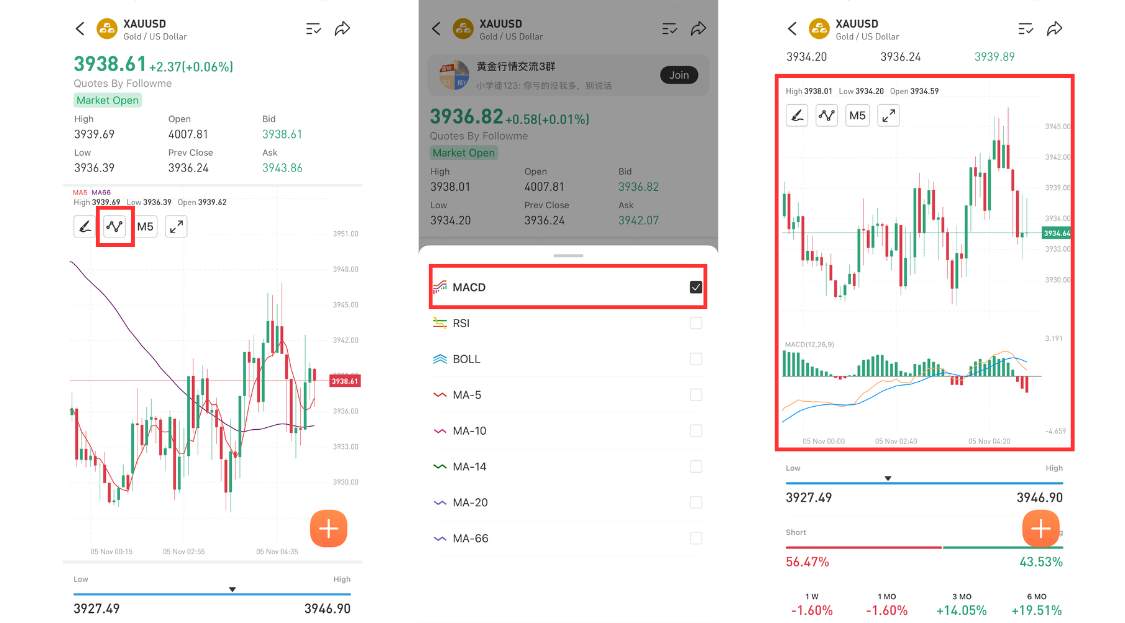
Chart Interpretation:
The red histogram is getting smaller and moving closer to the zero line → this means selling pressure is starting to fade.
The blue line (MACD Line) is almost aligned with the orange line (Signal Line) → an early sign of a potential bullish crossover if the move continues upward.
In short: the market is attempting to rebound after a selling phase, but a strong bullish confirmation only appears once the blue line actually crosses above the orange line.
2. RSI (Relative Strength Index)
RSI is an indicator used to measure the strength of price momentum. Its value ranges from 0 to 100 and helps traders identify whether the market is overbought or oversold.
How to Read It:
- Above 70 → Overbought condition (price has risen too high and may face a correction).
- Below 30 → Oversold condition (price has fallen too much and may rebound upward).
- Between 40–60 → Neutral zone (market is consolidating or trendless).
Chart Explanation:
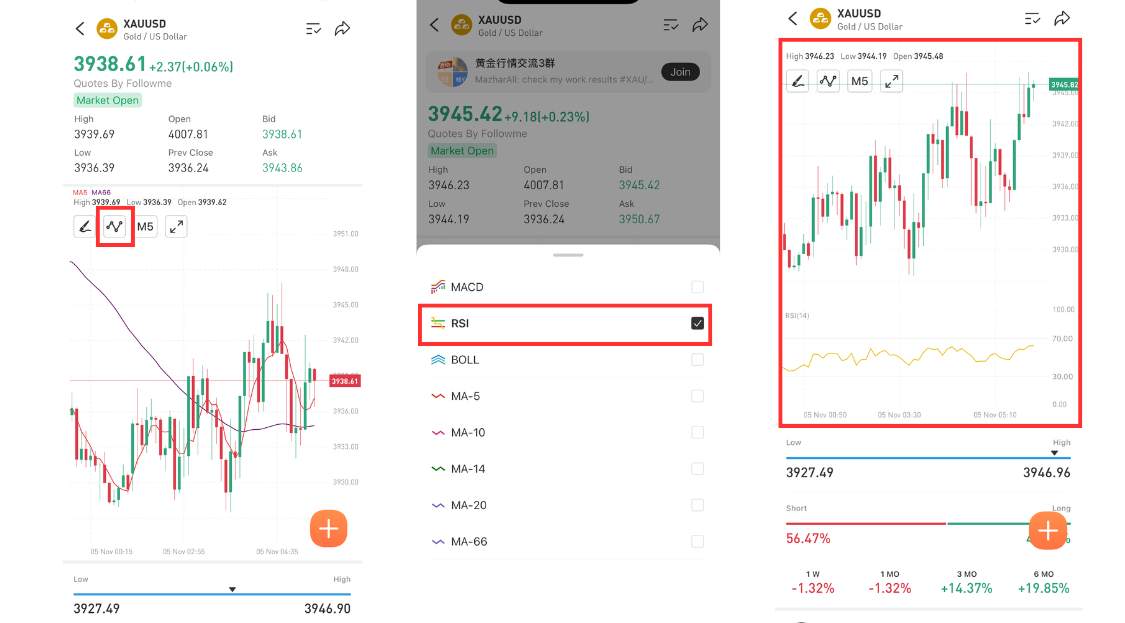
The yellow RSI(14) line is seen moving around the 50–60 level, which means momentum is neutral but slightly bullish. It’s not yet overbought (hasn’t reached 70) but is already moving away from the oversold zone.
- If RSI continues rising toward 70, traders usually become cautious of a possible correction.
- If it drops closer to 30, it could signal a potential rebound opportunity.
On Followme, you can combine RSI with other indicators like MACD or Moving Average (MA) for stronger signal confirmation.
Example:
- RSI approaching 70 + MACD bullish crossover → the uptrend may continue (RSI near 70 shows strong buying momentum, and when confirmed by a bullish MACD crossover, the uptrend has a high chance of extending further).
3. Bollinger Bands (BOLL)
Bollinger Bands are a popular indicator used to measure market volatility, identify support and resistance zones, and detect potential overbought or oversold conditions.
How to Read It:
Bollinger Bands consist of three lines:
- Middle Band: the moving average of price movement
- Upper Band: the upper boundary
- Lower Band: the lower boundary
Chart Interpretation:
Price approaching the upper band → signals that price is relatively high (potential correction zone)
Price approaching the lower band → signals that price is relatively low (potential rebound zone)
Bands widening → indicates increasing volatility; the market may be entering a strong trend or preparing for a breakout
Bands narrowing → indicates low volatility; the market is likely consolidating and getting ready for a breakout in either direction
Chart Explanation:
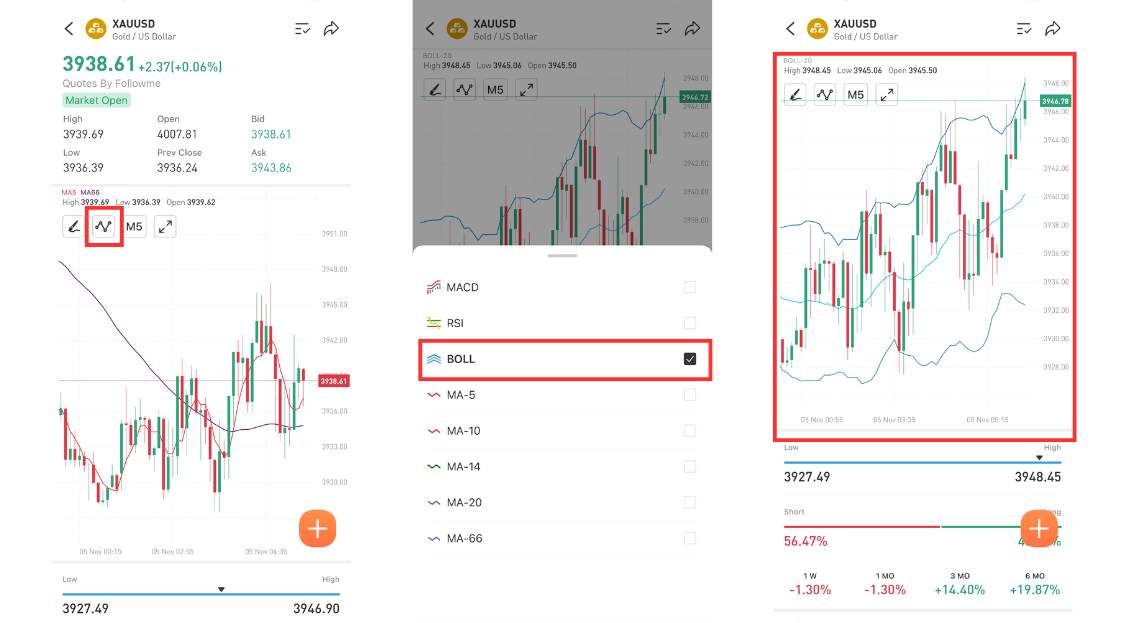
The price is moving upward and approaching the upper Bollinger Band, which indicates that buyers are starting to take control after a consolidation phase.
If the price continues climbing toward the upper band, the uptrend may extend further, with a potential resistance target near the top band.
4. Moving Average (MA)
Moving Average (MA) represents the average price over a specific period. There are various types of MAs, such as MA-5, MA-10, MA-20, and MA-66, each serving different trading purposes.
How to Read It:
- Short-term MAs (5 or 10): more sensitive, suitable for scalping or quick entries.
- Long-term MAs (20 or 66): more stable, useful for medium- to long-term trend confirmation.
Crossover Strategy:
When MA-5 crosses above MA-20 → bullish signal (uptrend potential).
When MA-5 crosses below MA-20 → bearish signal (downtrend potential).
Chart Explanation:
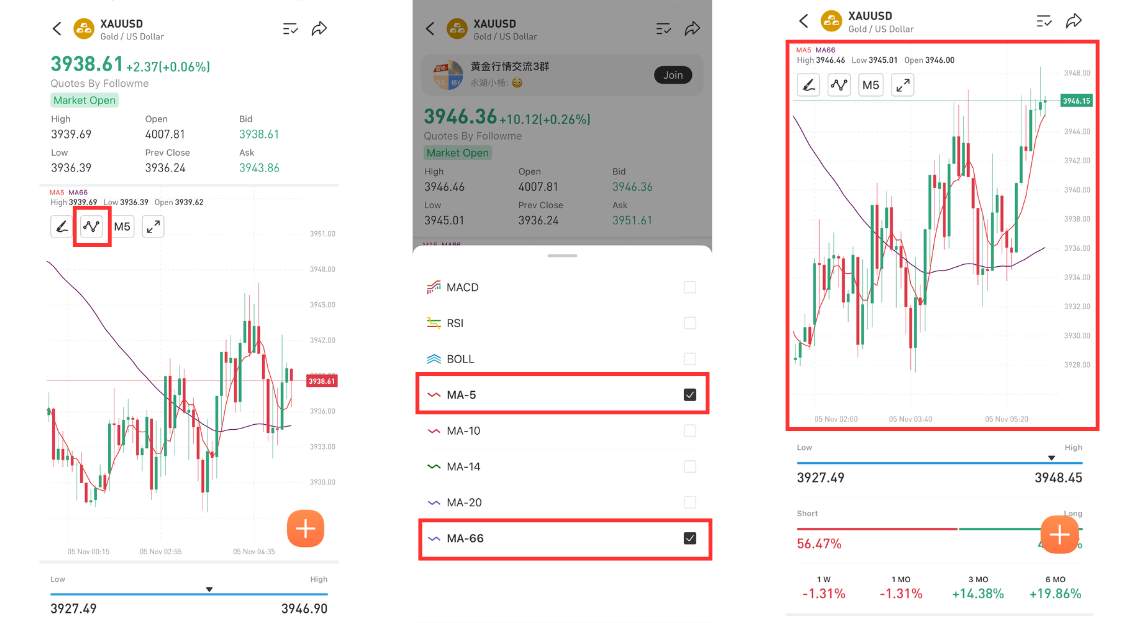
The current price movement shows that the main trend remains bullish (MA-66 is sloping upward), while the MA-5 has just turned upward, signaling short-term buying momentum.
As long as the price stays above the MA-5 line, there is potential for the uptrend to continue.
Why You Should Use Followme
Multi-Timeframe: Choose from a wide range of timeframes from M1 (1-minute) to MO (1-month) charts.
Complete Indicators: Combine MACD, RSI, Bollinger Bands, and MA all at once to confirm signals more accurately.
Interactive Experience: Simply click an indicator from the menu and see it appear instantly on your real-time chart.
Learn from the Community: While analyzing charts, you can read posts, share ideas, and discuss strategies with other traders in the Followme community who are analyzing similar signals.
Practical Tips for Beginner Traders:
1. Don’t rely on a single indicator combine at least two (e.g., RSI + MA) for confirmation.
2. Match your analysis with the right timeframe use 1D for major trends, and 1H or M15 for entries.
3. Use Followme’s built-in tools to test indicators before entering real positions.
4. Observe how other traders use the same indicators it can inspire new strategies and improve your trading logic.
Disclaimer: The views expressed are solely those of the author and do not represent the official position of Followme. Followme does not take responsibility for the accuracy, completeness, or reliability of the information provided and is not liable for any actions taken based on the content, unless explicitly stated in writing.

-THE END-