· Views 7,420
📊 Key Data Highlights
ISM Services PMI (July): 50.1
- Down from June’s 50.8. Below expectations of 51.5
- Indicates marginal expansion in the services sector
Prices Paid Index: 69.9
- Up from 67.5 in June. Highest level since October 2022
- Signals intensifying inflationary pressures
📉 Market Reaction Overview
💵 U.S. Dollar (USD)
- Despite the weaker-than-expected PMI, the U.S. Dollar Index (DXY) attempted to stabilize above the 99.00 level.
- The dollar’s resilience was partly due to its rebound from a prior sell-off triggered by disappointing Non-Farm Payrolls data.
- However, growing expectations of Federal Reserve rate cuts—now priced in with over 90% probability for September—kept the dollar under pressure.
🪙 Gold (XAU/USD)
- Gold prices pulled back slightly from recent highs, settling near $3,371 per ounce, down 0.06% on the day.
- The initial reaction Gold rose near $3390 per ounce post-PMI announced
🧠 Economic Interpretation
The July ISM Services PMI paints a picture of sluggish growth in the U.S. services sector, with:- Employment Index falling to 46.4 (contraction territory)
- New Orders barely expanding at 50.3
- Prices Paid surging to 69.9, raising stagflation fears
🔍 Conclusion
The ISM Services PMI release on August 5, 2025, delivered a mixed message: mild expansion, worsening employment, and accelerating inflation. Markets responded with caution - As traders brace for further macro data and central bank signals, volatility is likely to remain elevated.🚀 Next Market Movers to watch Next
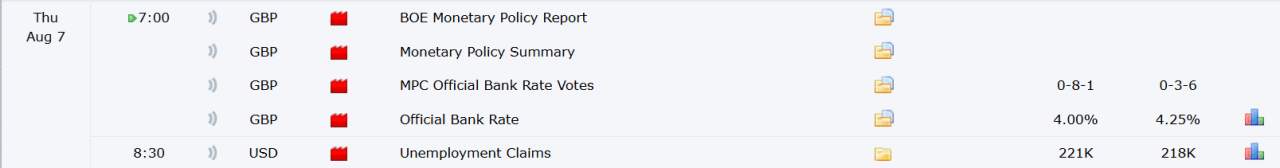
See full economic calendar
Follow Followme for the next analysis and forecast.
Disclaimer: The views expressed are solely those of the author and do not represent the official position of Followme. Followme does not take responsibility for the accuracy, completeness, or reliability of the information provided and is not liable for any actions taken based on the content, unless explicitly stated in writing.
Like this article? Show your appreciation by sending a tip to the author.

-THE END-