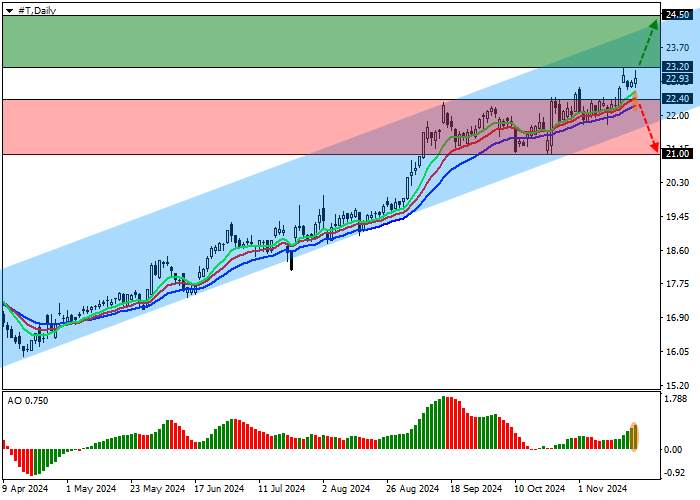
Shares of AT&T Inc., one of the largest US telecommunications companies, corrected at the 23.00 level.
On the daily chart, the price is approaching the resistance line of the ascending channel with dynamic boundaries 24.00-21.00.
On a four-hour timeframe, after holding above the high of 22.50, prices may reach the range resistance line at 24.50. In case of a reversal and decline and consolidation below the recent set of highs around 22.00, the asset will enter a correction phase with a target at the channel support level at 21.00.
Technical indicators maintain a stable buy signal: the fast EMA on the Alligator indicator is moving away from the signal line, and the AO histogram is forming bullish bars in the positive zone.
Trading Tips
Long positions can be opened after the price rises and fixes above the level of 23.20 with a target at 24.50. Stop loss - 22.70. Execution period: 7 days or more.
Short positions can be opened after the price falls and fixes below the level of 22.40 with a target at 21.00. Stop loss - 23.00.
Disclaimer: The content above represents only the views of the author or guest. It does not represent any views or positions of FOLLOWME and does not mean that FOLLOWME agrees with its statement or description, nor does it constitute any investment advice. For all actions taken by visitors based on information provided by the FOLLOWME community, the community does not assume any form of liability unless otherwise expressly promised in writing.


Load Fail()