
| Scenario | |
|---|---|
| Timeframe | Weekly |
| Recommendation | SELL STOP |
| Entry Point | 71.80 |
| Take Profit | 68.75, 67.19 |
| Stop Loss | 73.30 |
| Key Levels | 67.19, 68.75, 73.44, 75.00, 76.56 |
| Alternative scenario | |
|---|---|
| Recommendation | SELL LIMIT |
| Entry Point | 75.00 |
| Take Profit | 68.75, 67.19 |
| Stop Loss | 76.50 |
| Key Levels | 67.19, 68.75, 73.44, 75.00, 76.56 |
Current trend
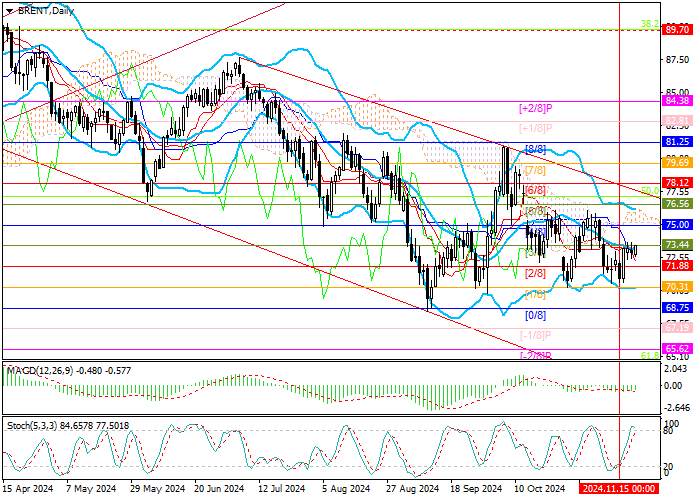
This week, Brent Crude Oil attempted to rise and is currently around 73.44 (Murrey level [3/8], middle line of Bollinger Bands), receiving short-term support from the approval by the outgoing US President Joe Biden’s administration of the use of American weapons to destroy targets in Russia, which could lead to an additional escalation of the military conflict.
Experts see two possible consequences of this step. On the one hand, the target could be oil infrastructure, which would lead to a decrease in oil supply from one of the leading oil producers. On the other hand, the response from official Moscow will likely include attacks on US and allied facilities, including in the world’s oil and gas regions, thereby significantly increasing global geopolitical tensions, which traditionally support the growth of energy prices. However, judging by the restrained market reaction to the latest events, investors do not yet believe in an escalation of the situation, being concerned with the consequences of the return of the Republican Party representative, Donald Trump, to the White House. Analysts agree that his policy will become the most serious factor in pressure on the oil market in the long term since the official can start a new trade war with China and possibly with the EU, increasing duties on exported goods from 10.0% to 60.0%. Of course, such steps will lead to a decrease in global production and, consequently, a decrease in petroleum products demand. In these conditions, only an additional reduction in production by OPEC members, who are already limiting production by 2.2M barrels per day, will be able to offset the negative dynamics of quotations. However, it is unclear whether these efforts will stabilize the market.
Thus, in the short term, an increase in Brent Crude Oil is likely. However, the market will stay under pressure.
Support and resistance
Technically, the price is holding within a long-term downward channel, currently testing 73.44 (Murrey level [3/8], the middle line of Bollinger bands). A breakout will allow it to reach 75.00 (Murrey level [4/8]) and 76.56 (Murrey level [5/8]) area. Otherwise, the decline to 68.75 (Murrey level [0/8]) and 67.19 (Murrey level [–1/8]) will resume.
Technical indicators allow for a continuation of the downward dynamics: Bollinger bands are directed downwards, the MACD histogram is stable in the negative zone, and Stochastic has approached the overbought zone and may reverse downwards.
Resistance levels: 73.44, 75.00, 76.56.
Support levels: 68.75, 67.19.
Trading tips
Short positions may be opened from 71.80 or when the price reverses around 75.00, with the targets of 68.75, 67.19 and stop losses of 73.30 and 76.50, respectively. Implementation period: 5–7 days.
风险提示:以上内容仅代表作者或嘉宾的观点,不代表 FOLLOWME 的任何观点及立场,且不代表 FOLLOWME 同意其说法或描述,也不构成任何投资建议。对于访问者根据 FOLLOWME 社区提供的信息所做出的一切行为,除非另有明确的书面承诺文件,否则本社区不承担任何形式的责任。
FOLLOWME 交易社区网址: www.followme.com


加载失败()