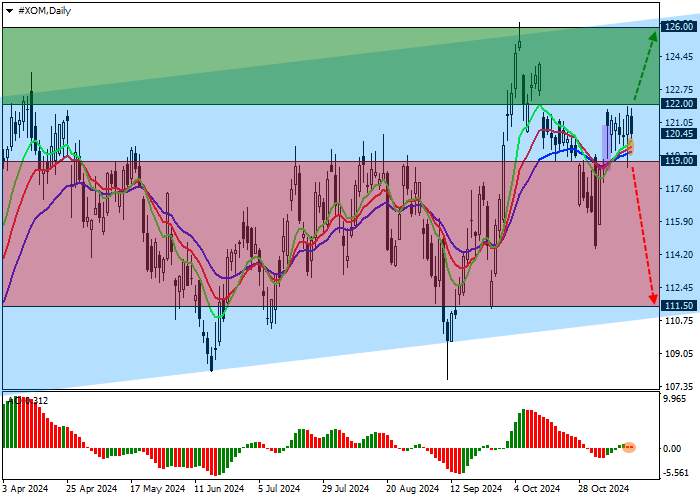
Shares of ExxonMobil Corp., an American oil company, are trading in a correction trend at 120.00.
On the daily chart, the price could not leave the ascending channel 126.00–110.00 and is held below its resistance line.
On the four-hour chart, the quotes are above the resistance level of 119.00 and can renew the high of 126.00. However, after a breakdown of 119.00, the price may reach the support level of 110.00.
Technical indicators are in a buy state: fast EMAs on the Alligator indicator are held slightly above the signal line, and the AO histogram forms downward bars in the positive zone.
Trading tips
Long positions may be opened after the price grows and consolidates above 122.00, with the target at 126.00. Stop loss is around 120.00. Implementation period: 7 days or more.
Short positions may be opened after the price declines and consolidates below 119.00, with the target at 111.50. Stop loss — 122.00.


加载失败()