Shares of The Procter & Gamble Co., one of the leaders in the consumer goods market, are trading in a correction trend at 161.00.
On the daily chart, the price is moving away from the lower limit of the ascending channel with dynamic boundaries of 184.00–168.00, strengthening the downward movement.
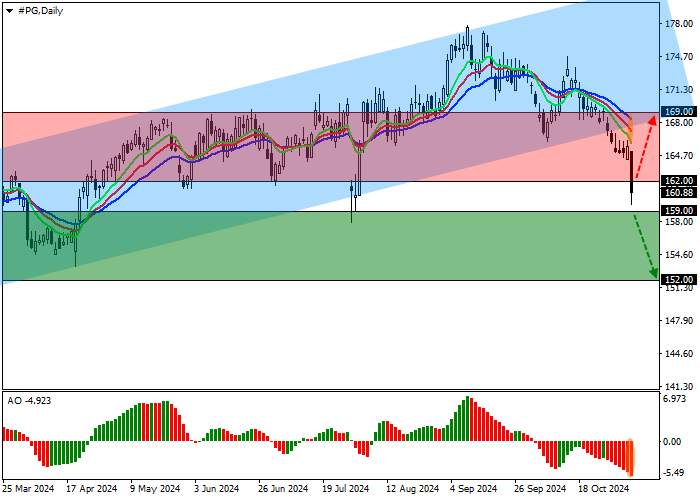
On the four-hour chart, the quotes may reach the nearest low of 159.00. After consolidation below, short positions with the target at 150.00 are relevant. In case of growth to the channel support level of 166.00, the upward dynamics are likely to continue.
Technical indicators reflect continued sales in the asset: fast EMAs on the Alligator indicator are below the signal line, and the AO histogram has formed a downward bar below the transition level.
Trading tips
Short positions may be opened after the price declines and consolidates below 159.00, with the target at 152.00. Stop loss — 163.00. Implementation period: 7 days or more.
Long positions may be opened after the price grows and consolidates above 162.00, with the target at 169.00. Stop loss – 159.00.


加载失败()