| Scenario | |
|---|---|
| Timeframe | Weekly |
| Recommendation | BUY STOP |
| Entry Point | 1.3675 |
| Take Profit | 1.3793, 1.3916 |
| Stop Loss | 1.3590 |
| Key Levels | 1.3305, 1.3427, 1.3549, 1.3671, 1.3793, 1.3916 |
| Alternative scenario | |
|---|---|
| Recommendation | SELL STOP |
| Entry Point | 1.3595 |
| Take Profit | 1.3427, 1.3305 |
| Stop Loss | 1.3635 |
| Key Levels | 1.3305, 1.3427, 1.3549, 1.3671, 1.3793, 1.3916 |
Current trend
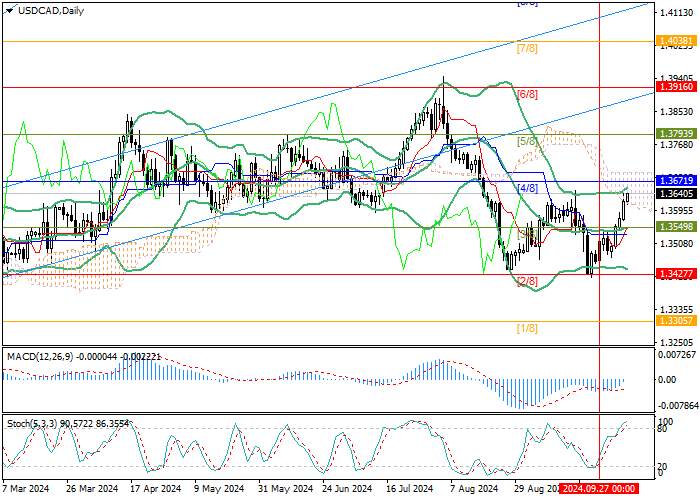
The USD/CAD pair is developing an upward trend, currently trading around 1.3540. Analysts are adjusting their forecasts regarding the pace of further monetary easing by the US Fed.
On Monday, the head of the regulator, Jerome Powell, admitted the possibility of a two-fold reduction in interest rates in November and December by 25 basis points each. It is contrary to the expectations of most investors, who assumed that at least one of them would be 50 percentage points. Nevertheless, strong data on the national labor market confirmed its cooling, allowing the authorities to make systematic changes to the parameters. Employment growth by 254.0K and a decrease in unemployment to 4.1% reflect the stability of the US economy and the low probability of a recession. On Wednesday at 20:00 (GMT 2), investors will pay attention to the minutes of the latest meeting of the Federal Open Market Committee (FOMC), which may contain more specific information about the department’s next steps.
Experts also expect officials from the Bank of Canada to continue easing monetary policy soon. This year, the cost of borrowing was corrected thrice by 25 basis points. However, in September, the head of the regulator, Tiff Macklem, said that this process should be accelerated if economic growth remained poor. Thus, if the data from the labor market due on Friday at 14:30 (GMT 2) show a slowdown in the sector, the likelihood of an interest rate adjustment by –50 basis points will increase, putting pressure on the national currency.
Support and resistance
The trading instrument is approaching 1.3671 (Murrey level [4/8]). Then, it may reach 1.3793 (Murrey level [5/8]) and 1.3916 (Murrey level [6/8]). In the case of the breakdown of the middle line of Bollinger bands 1.3549 (Murrey level [3/8]), a decline to the targets of 1.3427 (Murrey level [2/8]) and 1.3305 (Murrey level [1/8]) is likely.
Technical indicators do not give a single signal: Bollinger bands are horizontal, Stochastic has entered the overbought zone and may reverse downwards, and the MACD histogram is preparing to enter the positive zone.
Resistance levels: 1.3671, 1.3793, 1.3916.
Support levels: 1.3549, 1.3427, 1.3305.

Trading tips
Long positions may be opened above 1.3671, with the targets at 1.3793, 1.3916, and stop loss 1.3590. Implementation period: 5–7 days.
Short positions may be opened below 1.3549, with the targets at 1.3427, 1.3305, and stop loss 1.3635.
风险提示:以上内容仅代表作者或嘉宾的观点,不代表 FOLLOWME 的任何观点及立场,且不代表 FOLLOWME 同意其说法或描述,也不构成任何投资建议。对于访问者根据 FOLLOWME 社区提供的信息所做出的一切行为,除非另有明确的书面承诺文件,否则本社区不承担任何形式的责任。
FOLLOWME 交易社区网址: www.followme.com


加载失败()