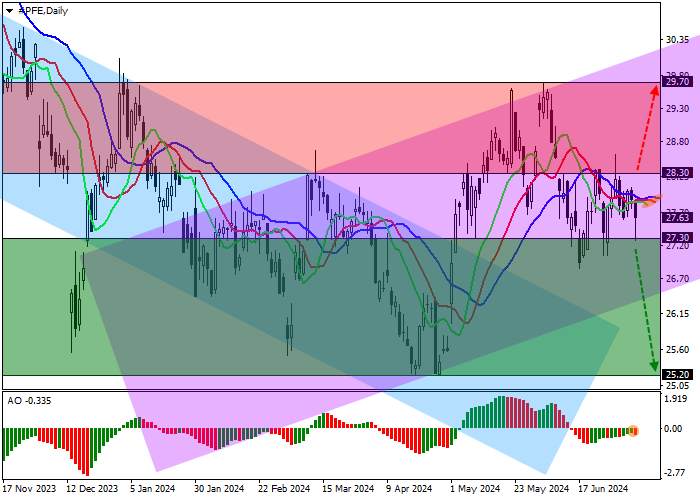
Shares of Pfizer Inc., the largest American pharmaceutical company, are correcting at 27.60.
On the daily chart, the price is holding above the resistance line of the global downward channel with dynamic boundaries of 26.50–23.00, approaching it for a reverse test.
On the four-hour chart, the quotes are close to the low of June 17 at 27.00. After a breakdown, it may reach the annual low of 25.20. If the asset consolidates above the high of June 24 at 28.30, a reversal and an upward movement may follow.
Technical indicators are holding a sell signal. Fast EMA on the Alligator indicator are below the signal line, and the AO histogram forms downward bars below the transition level.
Trading tips
Short positions may be opened after the price declines and consolidates below 27.30, with the target at 25.20. Stop loss — 28.20. Implementation period: 7 days or more.
Long positions may be opened after the price grows and consolidates above 28.30, with the target at 29.70. Stop loss — 27.50.


加载失败()