| Scenario | |
|---|---|
| Timeframe | Intraday |
| Recommendation | SELL |
| Entry Point | 1.76170 |
| Take Profit | 1.75255 |
| Stop Loss | 1.76900 |
| Key Levels | 1.75000, 1.75255, 1.76615, 1.76900 |
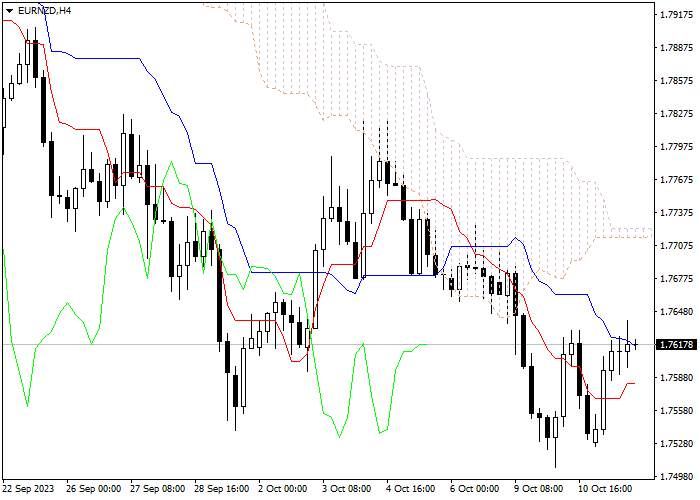
Let's look at the four-hour chart. Tenkan-sen line is below Kijun-sen, the lines are horizontal . Confirmative line Chikou Span is below the price chart, current cloud is descending. The instrument is trading between Tenkan-sen and Kijun-sen lines. The closest support level is the lower border of the cloud (1.76900). One of the previous maximums of Chikou Span line is expected to be a resistance level (1.75255).
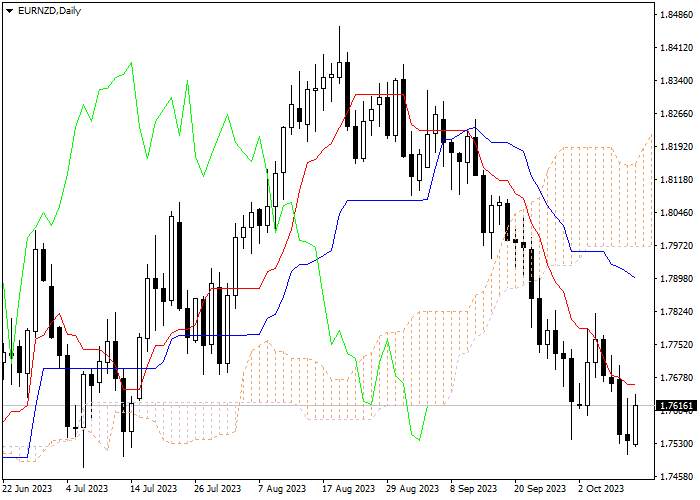
On the daily chart Tenkan-sen line is below Kijun-sen, both lines are directed downwards. Confirmative line Chikou Span is below the price chart, current cloud is ascending. The instrument is trading below Tenkan-sen and Kijun-sen lines; the Bearish trend is still strong. The closest support level is Tenkan-sen line (1.76615). One of the previous maximums of Chikou Span line is expected to be a resistance level (1.75000).
On the both charts the instrument is still falling. It is recommended to open short positions at current price with Take Profit at the level of previous minimum of Chikou Span line (1.75255) and Stop Loss at the level of Kijun-sen line (1.76900).
Disclaimer: The views expressed are solely those of the author and do not represent the official position of Followme. Followme does not take responsibility for the accuracy, completeness, or reliability of the information provided and is not liable for any actions taken based on the content, unless explicitly stated in writing.

Leave Your Message Now