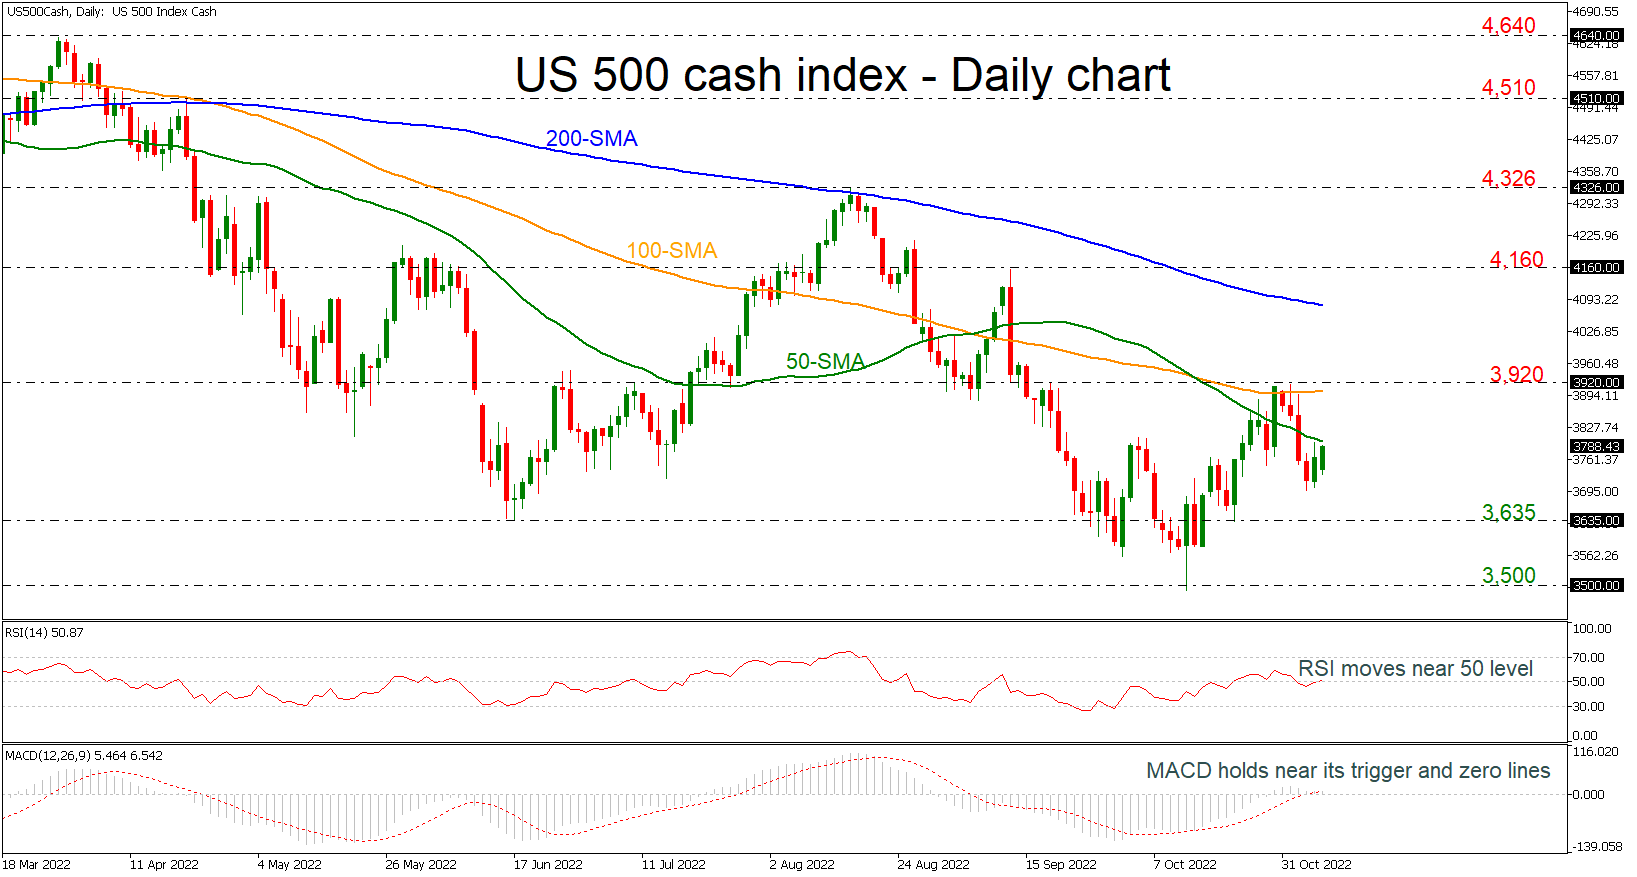
The US 500 stock index is moving slightly higher, approaching the 50-day simple moving average (SMA), holding well above the crucial 200-weekly SMA, which is acting as strong support level near 3,635. The RSI indicator is pointing slightly up near the neutral threshold of 50, while the MACD is moving sideways near its trigger and zero lines.
If price action jumps above the 50-day SMA (immediate resistance), there is scope to test the 100-day SMA around the 3,920 barrier. Clearing this key level would see additional gains towards the 200-day SMA at 4,080.
If the 3,635 support fails, then the focus would shift to the downside towards 3,500, which if breached would increase downside pressure and bring about a reversal of the trend. From here, the index would be on the path towards the 3,233 barrier, registered in October 2020.
Overall, the US 500 index has been negative in the long-term timeframe and only a climb above the 200-day SMA may change the outlook to bullish.
Disclaimer: The content above represents only the views of the author or guest. It does not represent any views or positions of FOLLOWME and does not mean that FOLLOWME agrees with its statement or description, nor does it constitute any investment advice. For all actions taken by visitors based on information provided by the FOLLOWME community, the community does not assume any form of liability unless otherwise expressly promised in writing.
FOLLOWME Trading Community Website: www.followme.com


Load Fail()