· Views 1,589
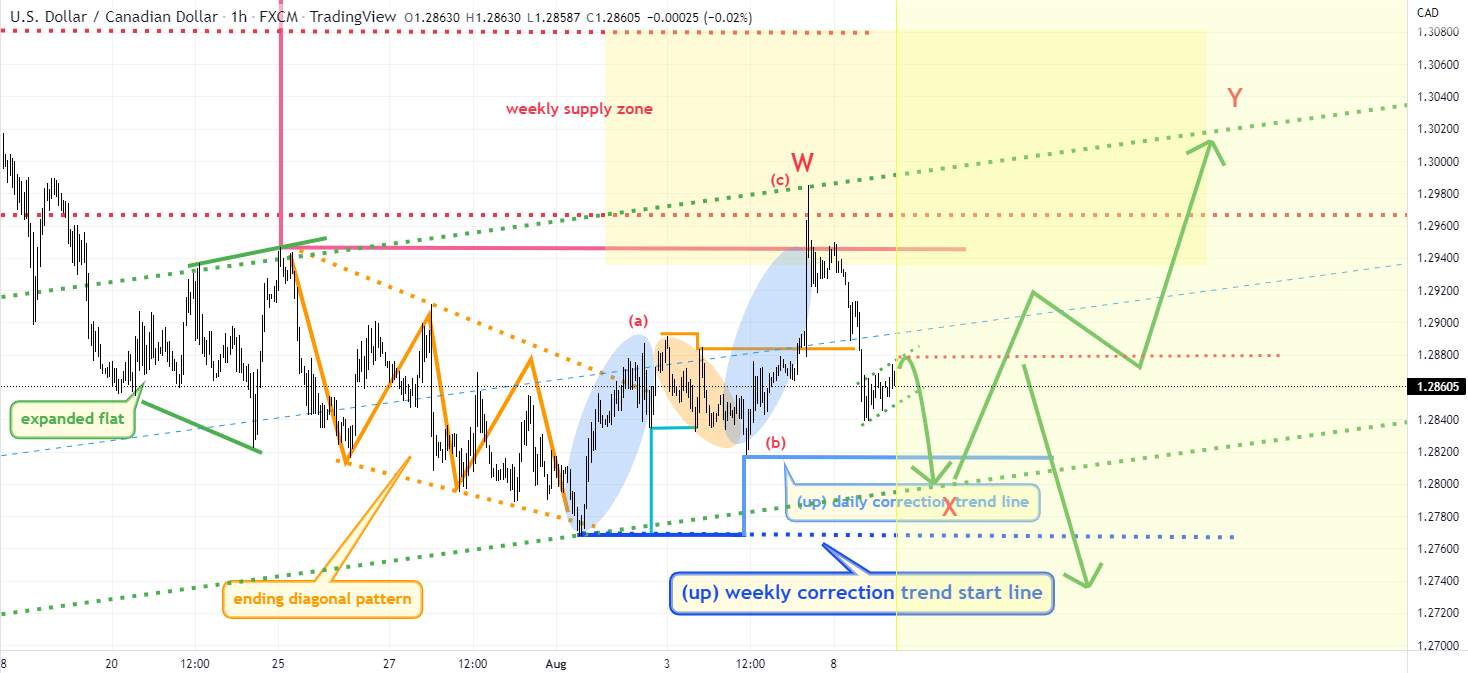
USDCAD is a daily bullish pattern , but if the daily correction trend line breaks and rebounds, there are two cases.
The first can be a daily bullish pattern with a reversal structure, with the starting line being the weekly correction trend starting line. The second can be a W-X-Y pattern of a complex structure. That is, after reaching the weekly supply zone once more, it creates a weekly correction trend line to the right of the downtrend and becomes a pattern that can fall again. If it rises strongly in the weekly supply zone , it could be followed by a daily upward wave with the first one being extended. However, if the correction start line is broken, the above two will become invalid, and it will become a daily downward wave pattern. #OPINIONLEADER#
Disclaimer: The views expressed are solely those of the author and do not represent the official position of Followme. Followme does not take responsibility for the accuracy, completeness, or reliability of the information provided and is not liable for any actions taken based on the content, unless explicitly stated in writing.
Like this article? Show your appreciation by sending a tip to the author.

Leave Your Message Now