In a world where nearly all central banks are delivering hawkish surprises (certainly relative to their own guidance), it’s the Fed’s turn to step up – one of the many roles as traders is to assess the risk of shock and it becoming a volatility (vol) event and to decide if there is a clear skew in the distribution of outcomes – if the skew in risk is seen as two-way or balanced (‘normally distributed’) then it can be prudent to reduce exposures over the event.
For me, this is where we look at rates pricing, to understand what’s already discounted, as well as positioning and expected movement.
Implied volatility
Derived from options pricing, this can tell us how the market is feeling about expected movement over a set period and this can dictate if the market sees an event (such as the FOMC meeting) as one that could impact our positions – so this becomes an essential part of our risk management. Many will use realised measures of vol, such as standard deviation, Bollinger Bands or ATR but this is based on past movement – we don’t dismiss it as a superb tool to help guide stops, but it is less predictive than implied vol.
As it stands, 1-week implied vol in most G10 FX pairs and XAU is around the 50th percentile of the 12-month range – the expiry here is the Tuesday, so it encompasses more event risk than just the FOMC meeting – either way, expected volatility and movement have come down a touch from last week, and this means utilising a tighter stop from the market/entry (than we would have last week) and potentially increasing the position size accordingly – at least for those who use a fixed dollar amount per trade.
(Implied volatility Matrix – we look at 1-week vol and calculate the implied trading range)
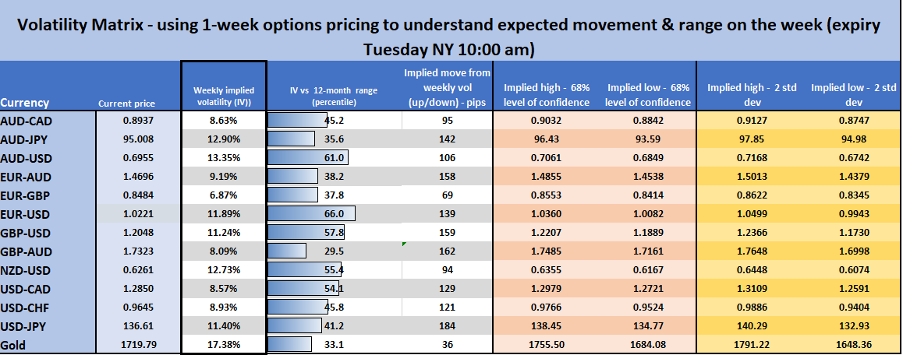
(Source: Pepperstone – Past performance is not indicative of future performance.
From a pure vol perceptive, the market is saying this is an event that can move broad markets, but it is not a defining moment in time – not like the June FOMC meeting and what we suspect will be the case in the September meeting.
Positioning
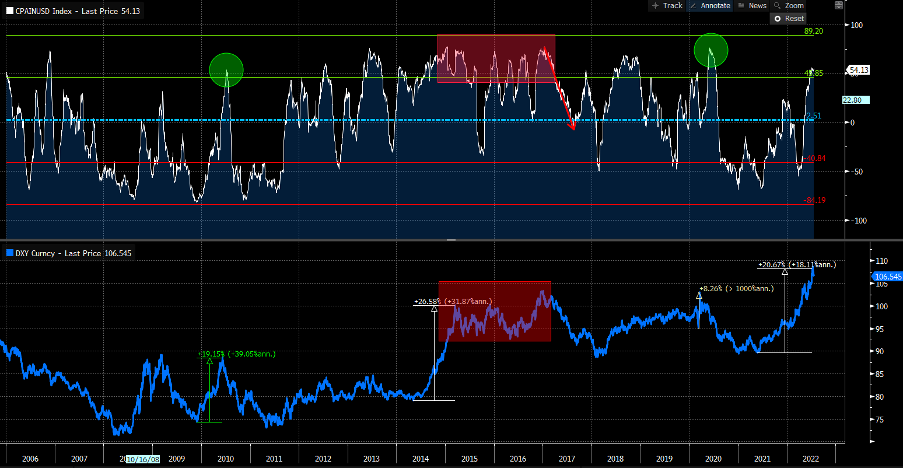
I see positioning in the USD as elevated – in the weekly CFTC report net USD longs are the highest since 2019 – As a percentage of open interest, USD longs are most extended vs the AUD, GBP, CHF, and JPY. While harder to source (I use Bloomberg), the Citigroup USD ‘PAIN’ index, which looks at the extent of USD positioning from a wide range of FX funds, shows the USD as the most crowded positioning since 2020, although it is still not at extremes. Either way, USD positioning is over two standard deviations of the long-term average and that suggests the FOMC statement will need to come up with something new or USD longs are at risk.
(Citi’s USD ‘PAIN’ index – looks at the crowdedness of USD positioning)
Disclaimer: The views expressed are solely those of the author and do not represent the official position of Followme. Followme does not take responsibility for the accuracy, completeness, or reliability of the information provided and is not liable for any actions taken based on the content, unless explicitly stated in writing.

Leave Your Message Now