The Simple 38.2 Fibonacci level forex trading strategy is based on the 38.2 Forex Fibonacci retracement level.
Background
Sometimes, when the price is in a market uptrend, it will start to reverse back down temporarily until it hits the forex 38.2 Fibonacci retracement level, and then it will bounce back up.
Similarly, the price will temporarily rise in a downtrend, only hitting the 38.2 Fibonacci level and falling again.
How To Draw the 38.2 Fibonacci Level Using The MT4 Fibonacci Tool
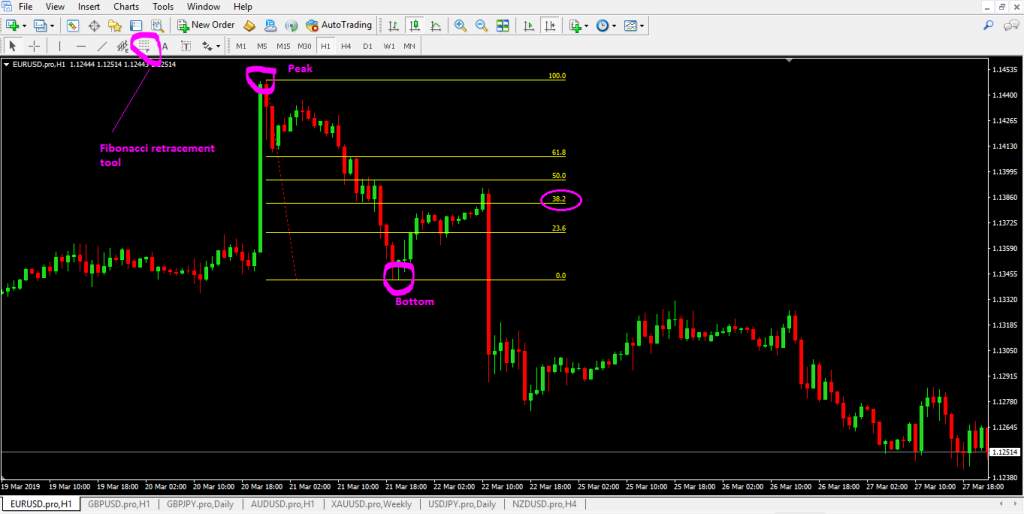
If you are using the metatrader4(mt4) trading platform, using the Forex Fibonacci retracement tool is simple.
If you look at EURUSD 1 hr Forex chart below, you can see the market made a peak and started to fall. But sometime later, the price began to rise. Where it rose from created a bottom (support level)
But this price rally was short-lived; as you can see, when the price hit the 38.2 Fibonacci retracement level, it fell and went past the bottom that was previously created.
To draw a Fibonacci retracement (it can be 38.2,23.6, 50, or 61.8) in a downtrend, these two must already happen:
- Peak is formed first
- and the bottom
And the next is that price must be rising from the bottom.
And the question is: at what level is the price going to start falling back. That’s where the Forex Fibonacci retracement tool comes into play.
Do draw a retracement level in a downtrend; there are only two steps.
Step 1: open the fibonacci retracement tool
Step 2: Click the peak, hold and drag to the bottom, and release. These will draw all those different Fib levels on your chart in any timeframe you are using.
Now you wait to see if the price will reach the 38.2 Fibonacci level and if it will fall from there.
So how can you know if the price will fall from the 38.2 Fibonacci level?
You won’t know. The best option is to study the price action patterns around that fib level and see you are seeing bearish reversal signals there and take a sell trade based on that.
How To Draw Fibonacci Uptrend?
You do the opposite of what you would have done in an uptrend.
The price must make a bottom and has risen, made a peak, and has started to fall down but hasn’t gone past the bottom yet.
Step 1: Open the fibonacci retracement tool.
Step 2: Click the bottom, hold and drag to the peak, and release. These will draw all those different Forex Fibonacci levels that price may hit and rise from, including 38.2% Fibonacci level.
The Forex 38.2 Fibonacci Level Trading Strategy Rules
We are just going to give the selling rules here, but it is the exact opposite of buying rules, so there should be no confusion.
Here’s how to sell using chart price action on the 38.2
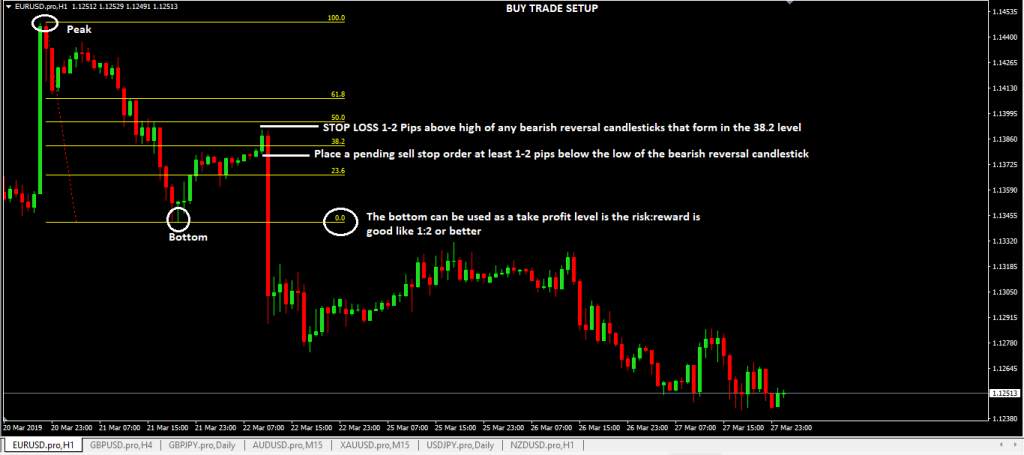
Step 1: Wait for the price to come up to the forex 38.2% Fibonacci retracement level
Step 2: When a chart bearish reversal candlestick pattern forms on the 38.2% level, then place a sell stop order 1-3 pips below the low of the bearish reversal candlestick
Step 3: Place your stop loss(SL) 1-2 pips above the high of the bearish reversal candlestick if you are trading bigger timeframes like the 1hr and upwards, but if smaller timeframes, you need to consider the spread and place your stop loss
Step 3: Place your take profit target on the 0.00% Fibonacci level, which will be the bottom of the price if the risk: reward is 1:2 or better.
Advantages
- This strategy is a straightforward but good price action trading system in a strongly trending market.
- Risk: reward ratios are good.
- The market tends to respond to these levels, especially 38.2 and 61.8, so it is another system to keep up your sleeves to trade such situations.
Disadvantages
- You are simply trading the 38.2% fib level without reversing candlestick patterns. Why?
- Because price can still go past 38.2% fib level and reverse down from 50& or 61.8 level so knowing reversal candlestick patterns is essential in my opinion. Otherwise, you will be just guessing.
- Like all trading systems, it has its weakness: a flat or sideways market is not suitable for this system.
#PhongVanFollowme#
Disclaimer: The views expressed are solely those of the author and do not represent the official position of Followme. Followme does not take responsibility for the accuracy, completeness, or reliability of the information provided and is not liable for any actions taken based on the content, unless explicitly stated in writing.

Leave Your Message Now