This article examines the recent price action in cryptocurrencies. Additionally, we discuss the short-term support and resistance levels for Bitcoin, Ethereum and Polkadot. Finally, we discuss if cryptocurrencies have entered a “crypto winter.”

Bitcoin – BTC continues to struggle. If we examine the 9-month chart, it appears that Bitcoin formed a major triple top dating back to 14 April 2021 (Chart #1). This is a bad sign for the bullish camp. In order to invalidate the tripe top, BTC must penetrate 68,906. This type of rally is highly unlikely any time in the near future. Instead, the most likely scenario is sideways trading with a bias to the downside.
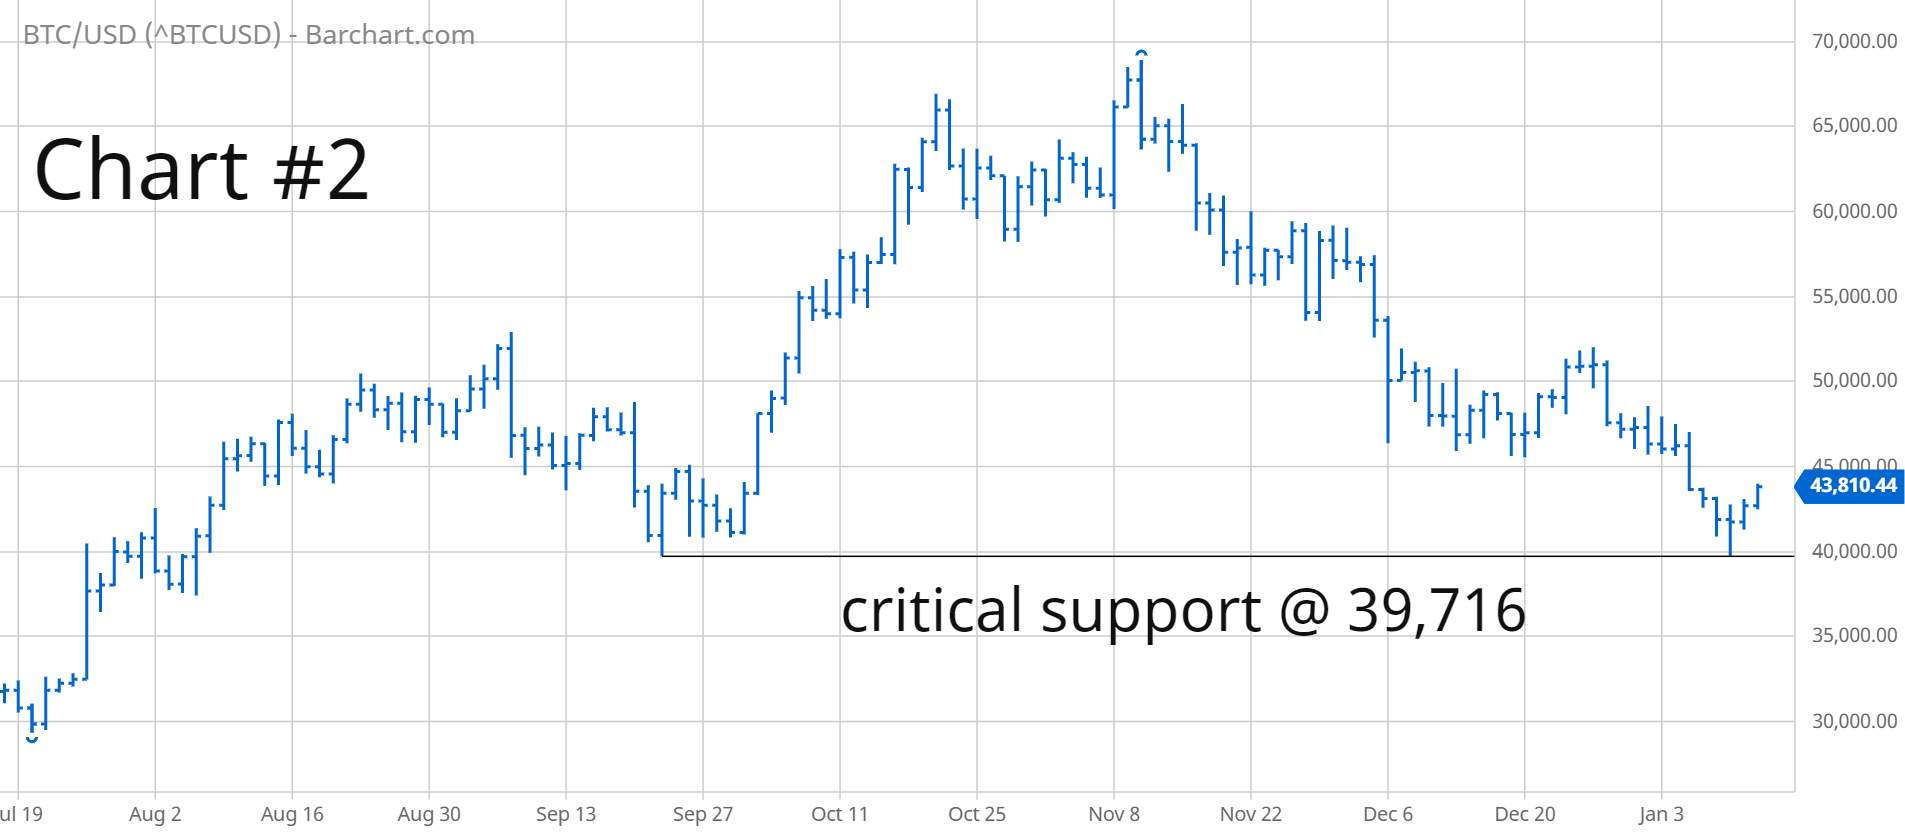
The critical support level on the daily chart is 39,716 (Chart #2). This number will determine the success or failure for BTC in 2022. If Bitcoin has any chance of recording a new all-time high in 2022, it must stay above 39,716 on a weekly closing basis. Will BTC drop below this critical support level? Despite the bearish price action during the past two months, it’s unlikely that BTC will generate a weekly close below 39,716.
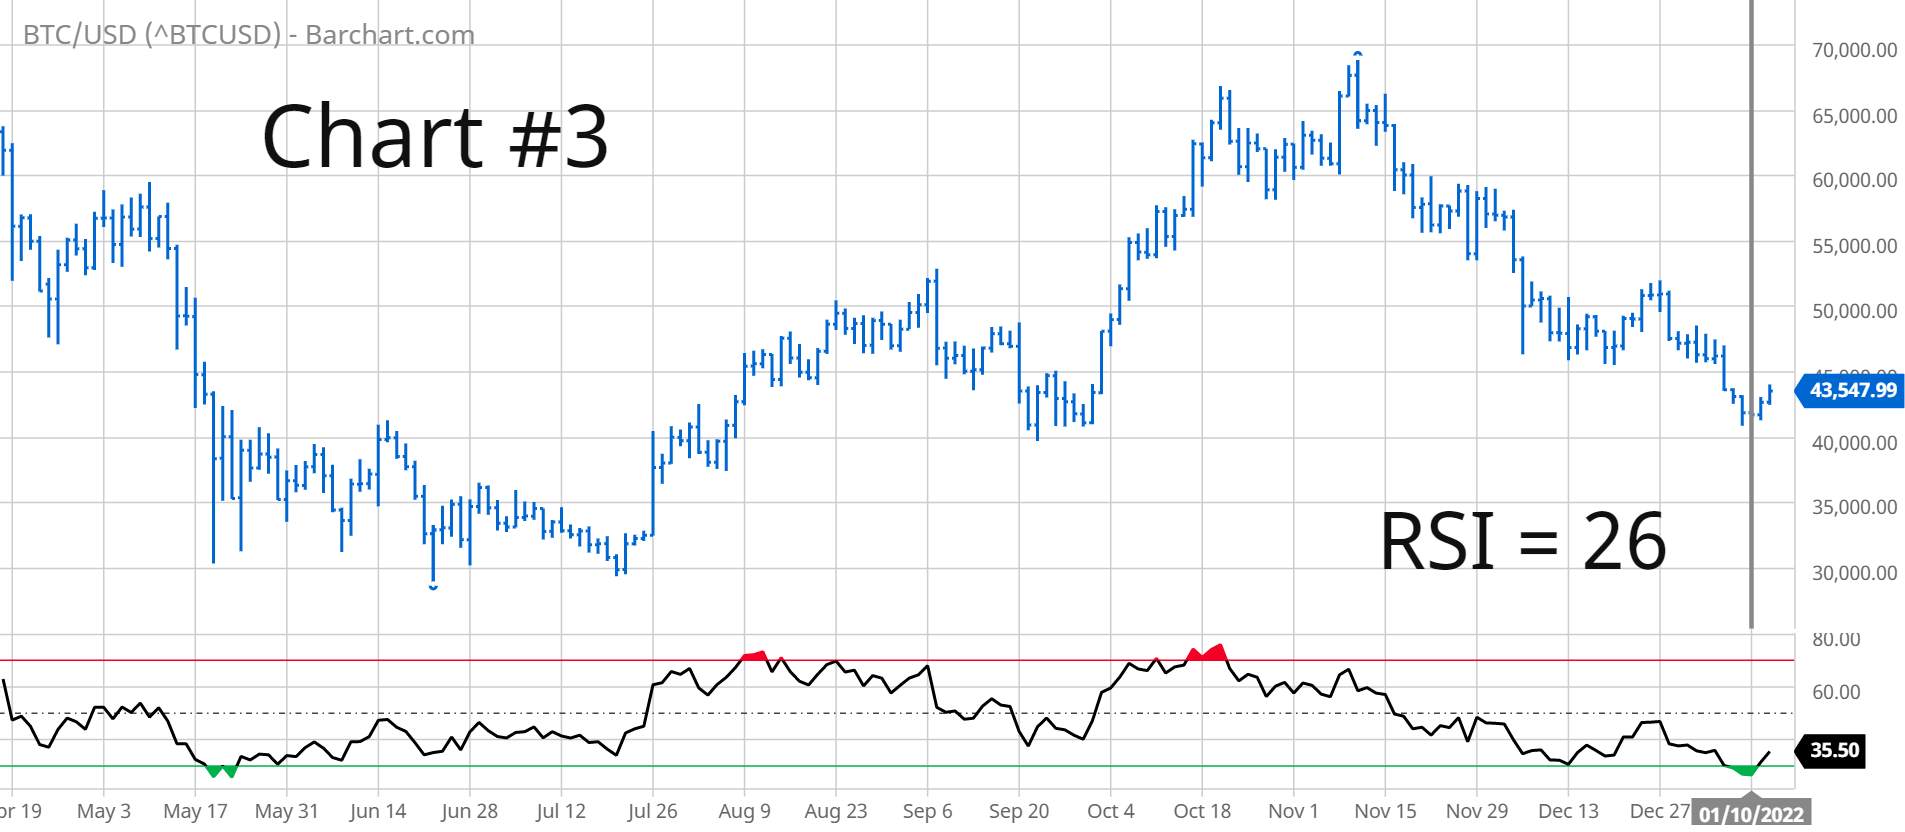
Chart #3 displays the Relative Strength Index. RSI is a momentum oscillator developed in 1978 by Welles Wilder, Jr. RSI is one of the most popular technical indicators among active traders. It works incredibly well with Bitcoin. The trading rules are very simple. A reading below 30 generates a buy signal. A sell signal is activated when RSI moves above 70. Traders prefer using RSI because it produces very few signals.
RSI generated a BTC buy signal on 10 January when the oscillator fell below 30. In fact, this was the lowest RSI reading for Bitcoin in over eight months. RSI declined to 26 on 10 January, which created a perfect short-term buy signal. There is a high probability that BTC marked an important low on 10 January @ 39,713.
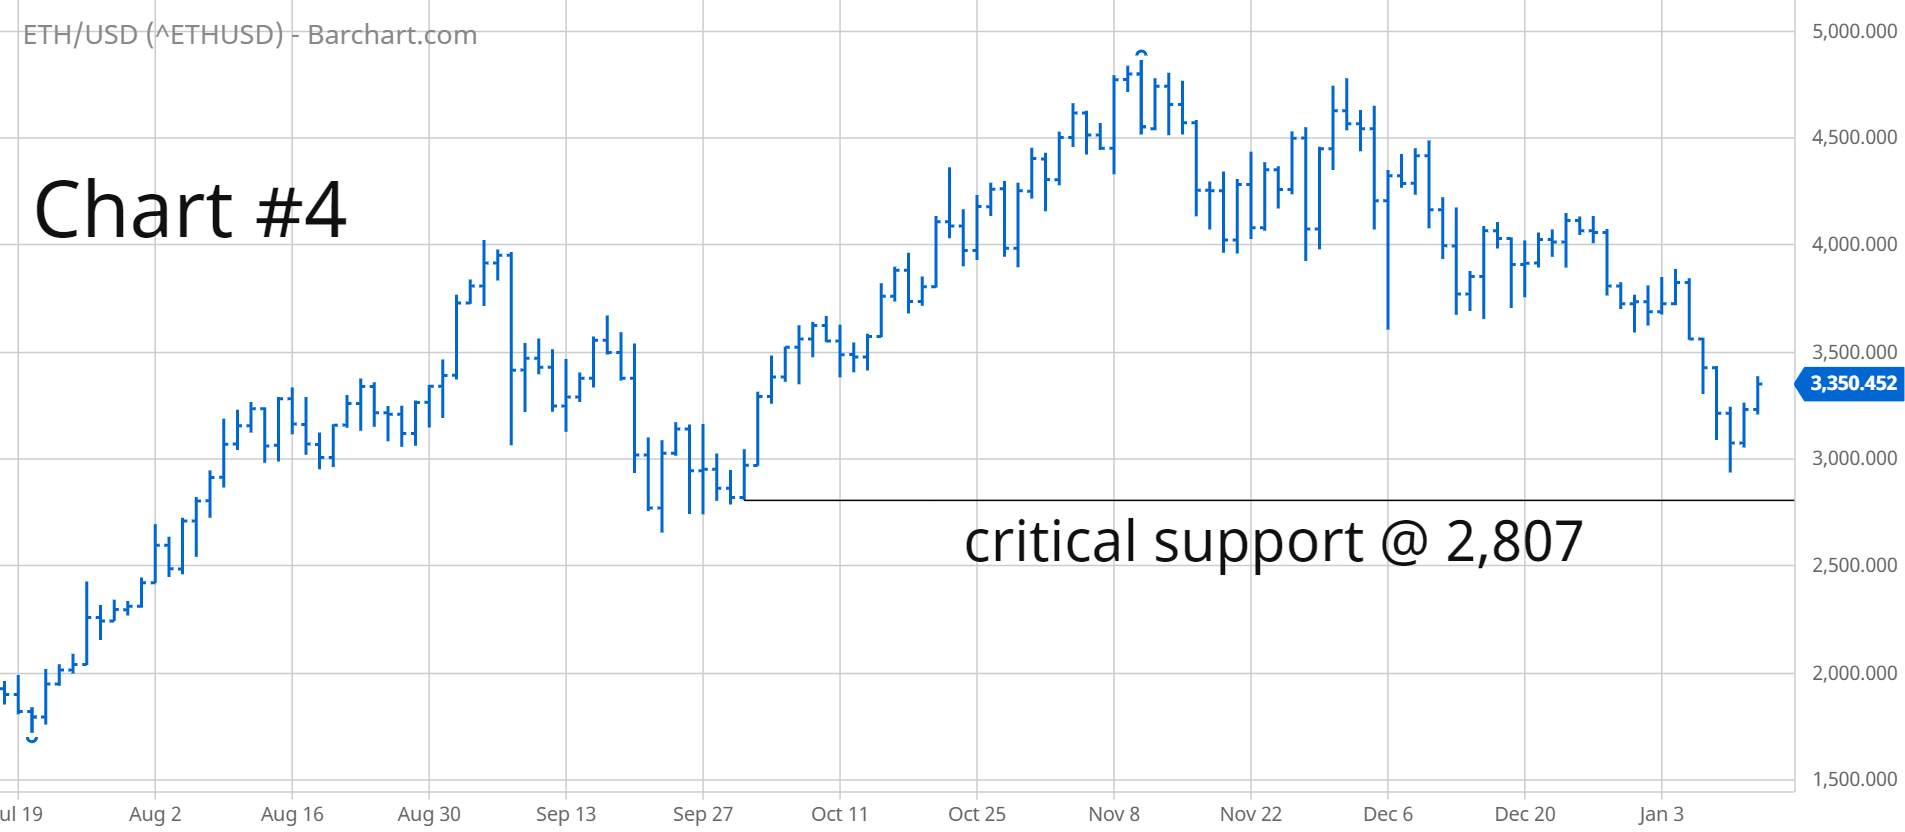

Ethereum – The short-term Ethereum chart is rolling over to the downside. The critical support level is 2,807 (Chart #4). A weekly close below 2,807 opens the door to much lower prices. Based on the current chart pattern, it appears that ETH will manage to stay above this important support level. A weekly close above 4,223 is needed in order to flip the momentum from bearish to bullish

Chart #6 displays six months of price activity based on the Money Flow Index. MFI is one of the best indicators for determining the amount of money flowing into a speculative asset. It combines time, price and volume into an oscillator format, thus allowing a trader to visually compare areas of divergence. As you can see from the chart, MFI was successful in forecasting a major top on 10 November. The price of Ethereum reached 4,865 while the Money Flow Index recorded its highest level in eight months @ 85. It appears that MFI may have forecasted a major low in ETH on 10 January @ 2,937. The Money Flow Index declined to 38, which represents one of the lowest levels in six months. Based on MFI, there is a high probability that Ethereum will not drop below 2,937.


Polkadot – DOT generated a substantial rally in 2021. From its low in December 2020, Polkadot increased 1,111%. A short-term top was formed on 4 November@ 55.06. DOT drifted lower throughout the final two months of 2021. It appears that an important bottom was formed on 10 January @ 22.84 (Chart #7). The chart pattern remains bullish as long as DOT stays above 20.12 on a weekly closing basis (Chart #8).
In terms of technical analysis, one of the most popular indicators is the Aroon Oscillator. This indicator works incredibly well at identifying important tops and bottoms in speculative assets like cryptocurrencies. The Aroon Oscillator is similar to the Relative Strength Index (RSI). It is a measuring device used to determine if an asset is overbought or oversold. The index fluctuates between -100 and +100. A reading of -100 indicates a market that is substantially oversold. A reading of +100 identifies a market that is heavily overbought.

The Aroon Oscillator performed incredibly well at identifying an important top and important bottom in DOT (Chart #9). On 20 July, the oscillator recorded a reading of -96, which indicates a deeply oversold market. The Aroon Oscillator was able to pinpoint the exact low in Polkadot @ 10.39. Polkadot generated a top on 4 November @ 55.06. The Aroon Oscillator successfully identified the top by recording a reading of +96. As you can see from the chart, the Aroon Oscillator is quite useful in its ability to recognize tops and bottoms.
Have Cryptocurrencies Entered A Crypto Winter?

What is a “crypto winter?” A crypto winter occurs when all coins and tokens enter a long-term period of lower prices. Essentially, a crypto winter is a bear market for cryptocurrencies. The most recent crypto winter began in December 2017. It officially ended in December 2020, when Bitcoin recorded a new high above 19,862 (Chart #10). Therefore, the crypto winter continued for three years.


When will the next crypto winter begin? Many traders believe that a new crypto winter began on 10 November 2021, when BTC generated a new all-time high @ 68,906 (Chart #11). If this analysis is correct, we can expect crypto prices to drift lower for the next 12 to 18 months. However, based on previous historical price patterns, it’s highly unlikely that we are in the early stages of a new crypto winter. Why? Because crypto winters are usually preceded by a parabolic move, similar to the rally in 2017 (Chart #12). The Bitcoin rally in 2021 was definitely not a parabolic move. Therefore, the likelihood of a crypto winter in 2022 and 2023 is very small. Instead, the most likely scenario during the next 24 months is a new crypto bull market.
Disclaimer: The views expressed are solely those of the author and do not represent the official position of Followme. Followme does not take responsibility for the accuracy, completeness, or reliability of the information provided and is not liable for any actions taken based on the content, unless explicitly stated in writing.

Leave Your Message Now