· Views 322
#OPINIONLEADER# #technicalanalysis#
May have some retracement to 1.175, but as long as I am seeing light demand a the retracement of yesterday bearish engulfing and supply being overweighting I am aiming at 1.15, and especially with a break under 1.17.
In fact ready for any time for a break under 1.17
On the monthly
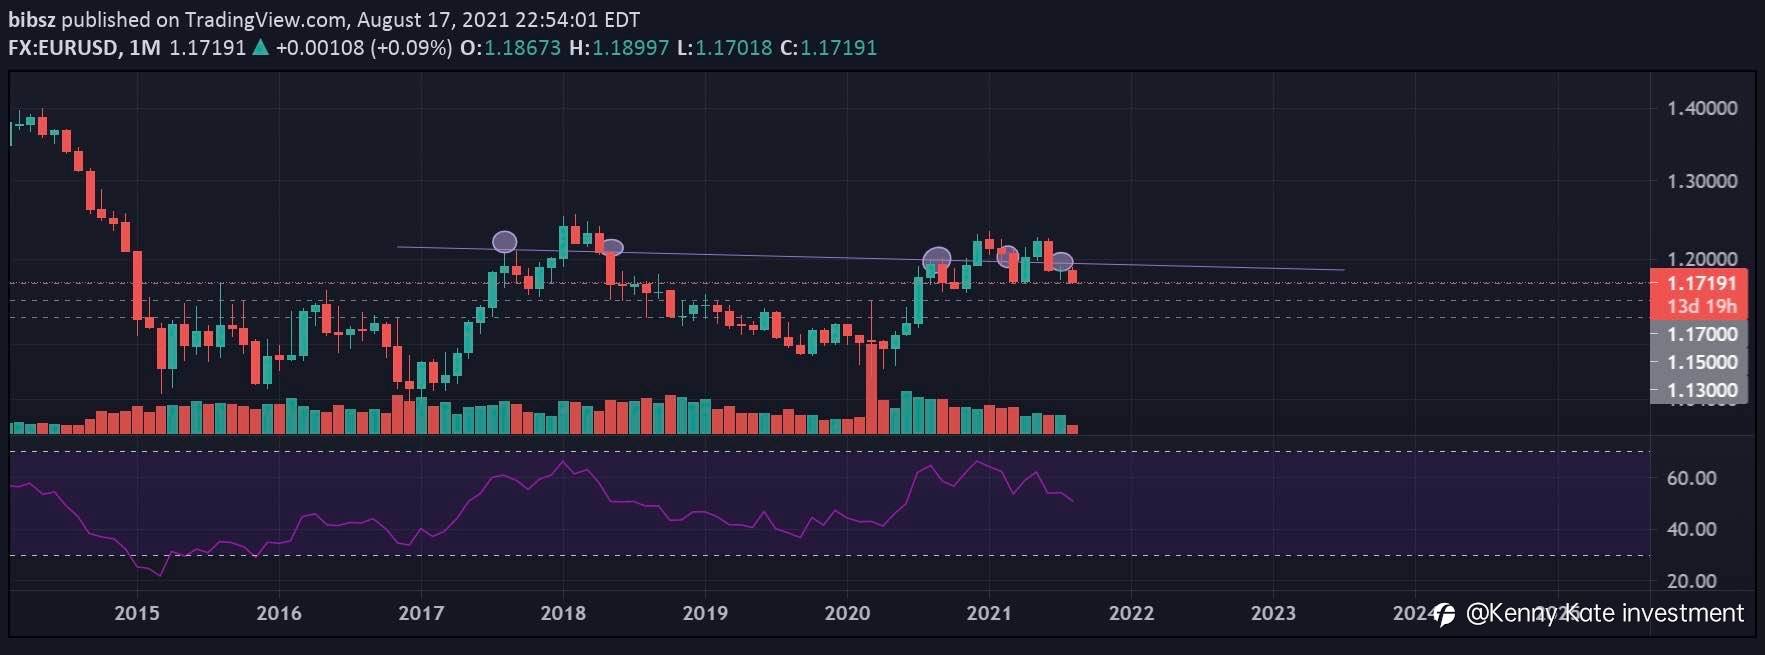
Supply has been in power since July'20. Also the upper trend of the channel formation has been a important demand weakening area since July'17, the 5 times it touched it. After a double top at 1.24 on heavy supply, last month retracement of June bearish engulfing closed on demand absorption at 1.20.
Weekly
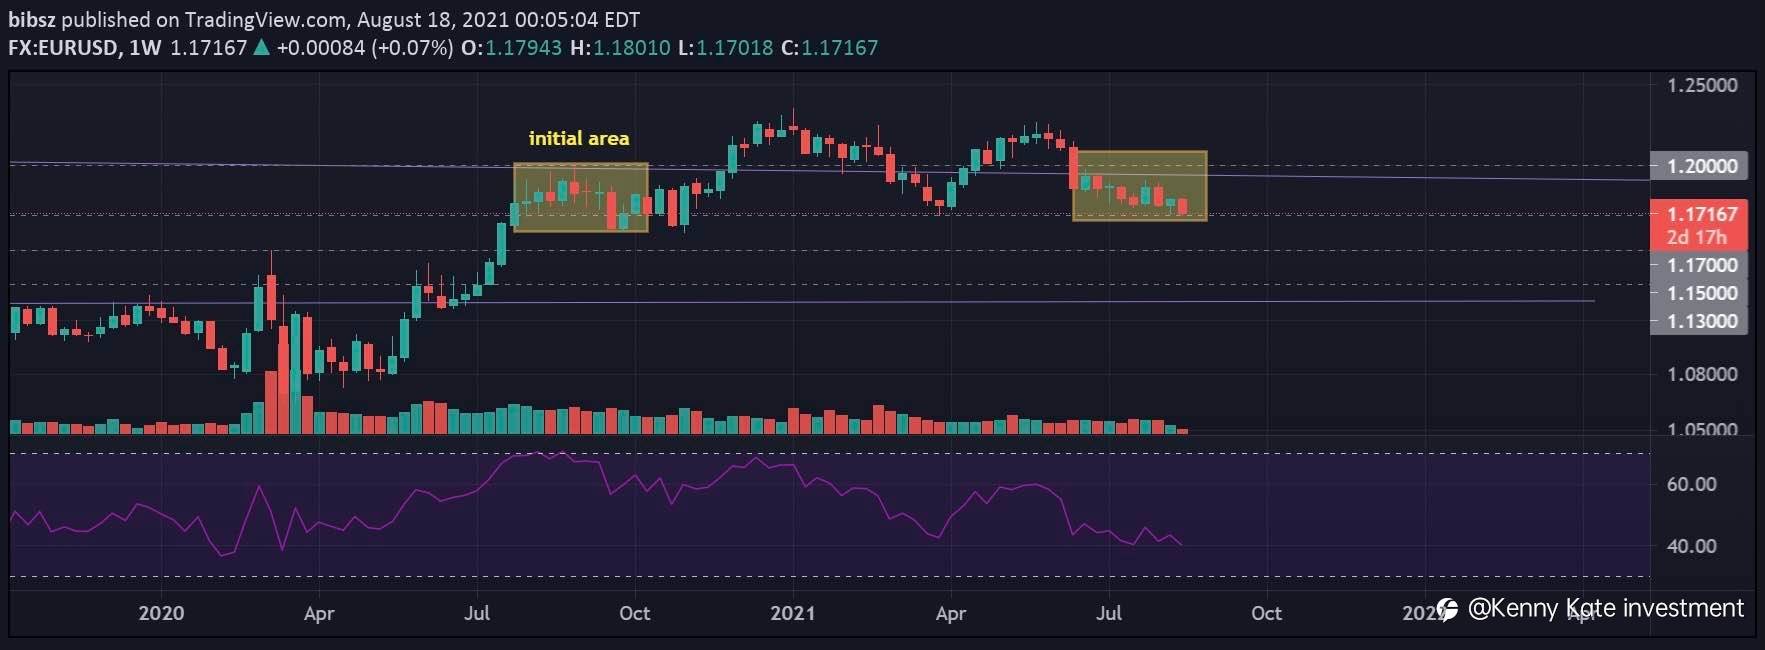
As seen in the current yellow area when compared to the initial yellow area of when it did reach 1.20, the buying interest is a less aggressive and attempting to push price higher. And that demand is showing a decrease as well as failures top push it any higher, having supply printing bearish engulfing's at the zone for the last 2 months.
Daily
Daily
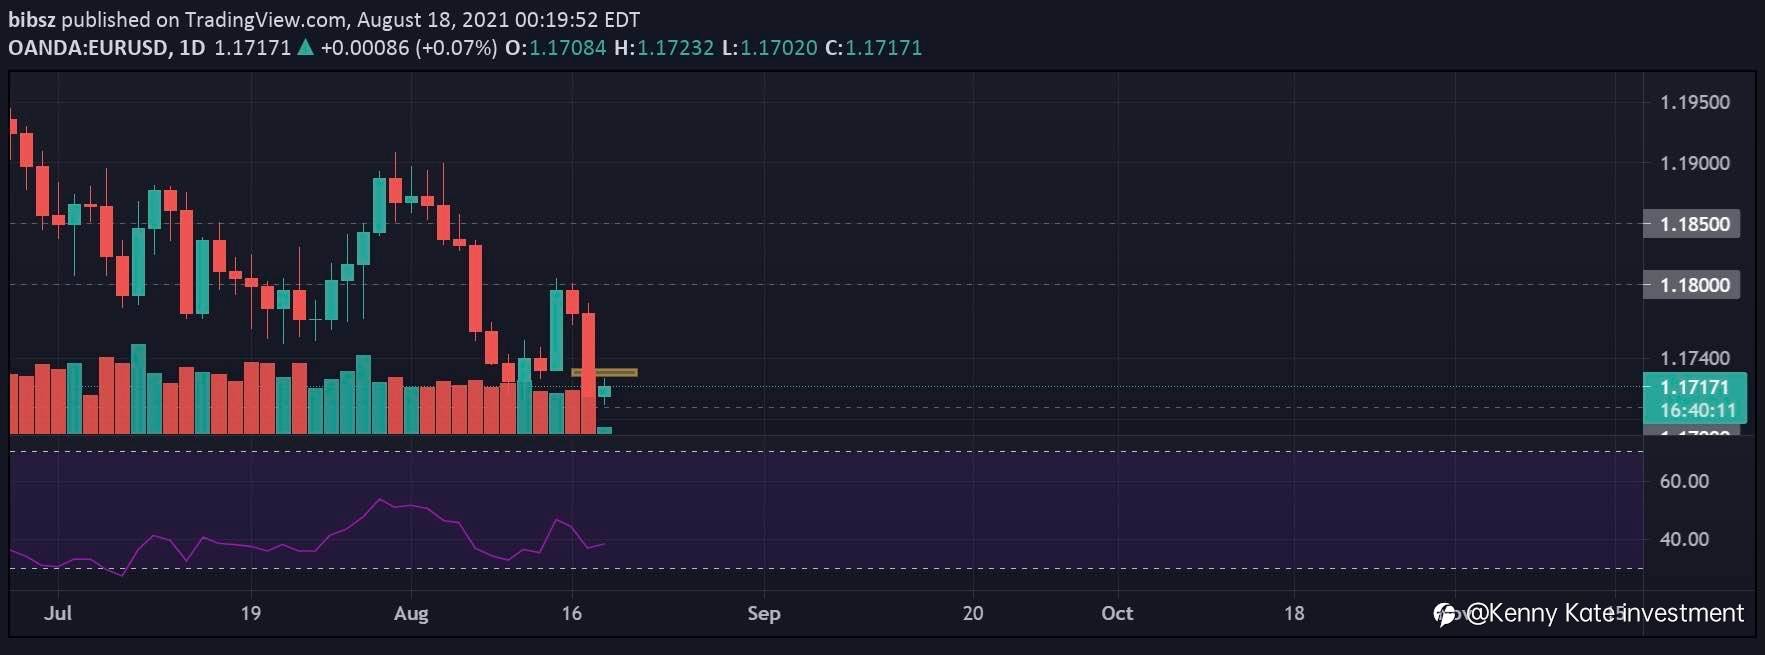
At the retracement from the drop from 1.19, price did print a bullish candle on the 13th August but since it was not backed up by demand volume it means that it was a break of selling interest. For them after to drag the price down to the 1.17 area with a bearish engulfing showing once again heavy supply, and having this current daily candle retracing it on light demand. Could still see a retracement a bit more higher before it continue further downward, per example around 1.175.
Disclaimer: The views expressed are solely those of the author and do not represent the official position of Followme. Followme does not take responsibility for the accuracy, completeness, or reliability of the information provided and is not liable for any actions taken based on the content, unless explicitly stated in writing.
Like this article? Show your appreciation by sending a tip to the author.

Leave Your Message Now