My strategy is based on chart analysis using Price Action
Can not trade
1) On strong news.
use https://www.investing.com/econ...
2) When not sure about the deal.
3) When you are in a psychologically unstable state.
4) You can NOT AVERAGE DOWN, increase the volume of the transaction.
We trade on the H2-d1 timeframe (no need to SCALP or open low-quality deals)
We trade strictly on EURUSD, AUDUSD, NZDUSD, USDCHF, USDJPY, GBPUSD & GBPJPY.
Best on my strategy is trading GBPUSD, EURUSD & USDCHF.
It is important to understand that there will always be losses in trading, and the main thing is to trade, so that on average you have a plus.
Risk per trade ALWAYS 1% of the deposit.
The basics of my strategy
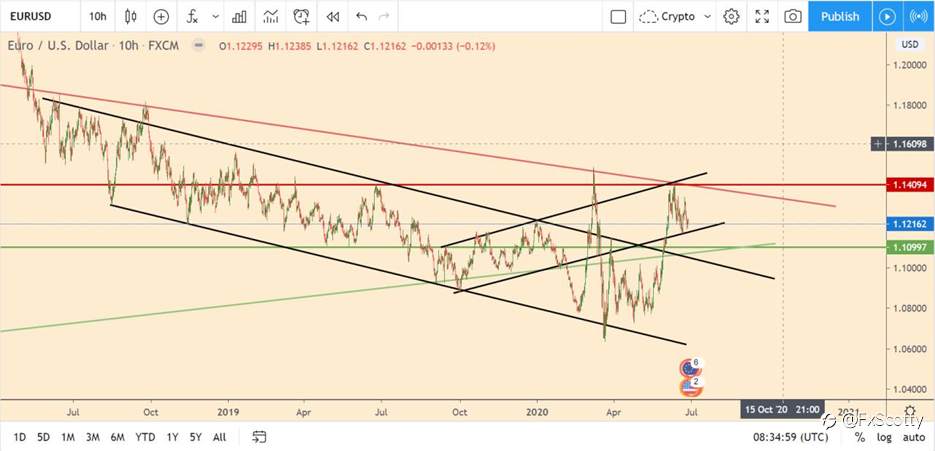
1. Open the chart on the timeframe D1 and build the main lines and levels
1.1. Building in Tradingview (When charts look beautiful it’s easier to analyze)
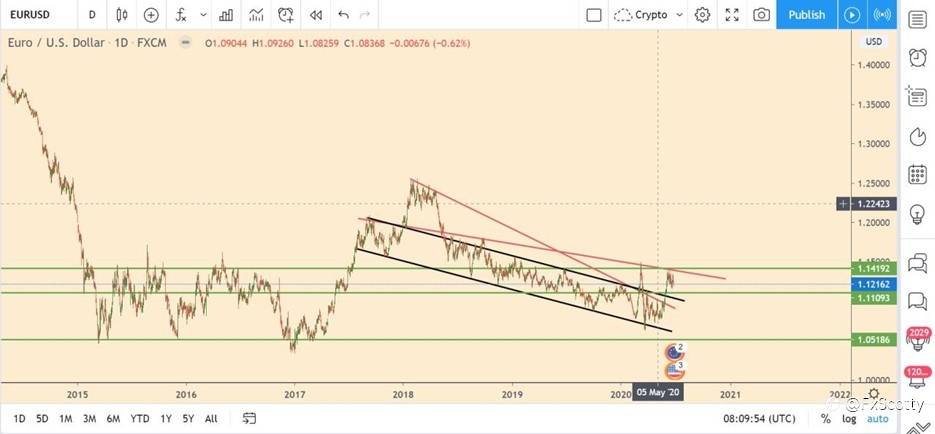
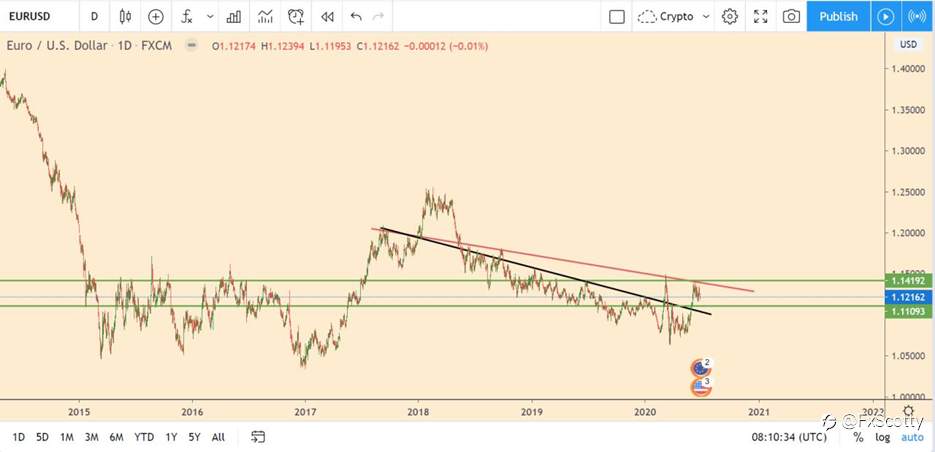
2. Next, remove unnecessary line levels
Unnecessary lines and levels are those that are far from the current price + delete levels
!! Important!! Trading from lines and levels has an exact entry point BUT! A level or line is not an exact value, but a small range of prices (For example, 1.1418 - 1.1420)
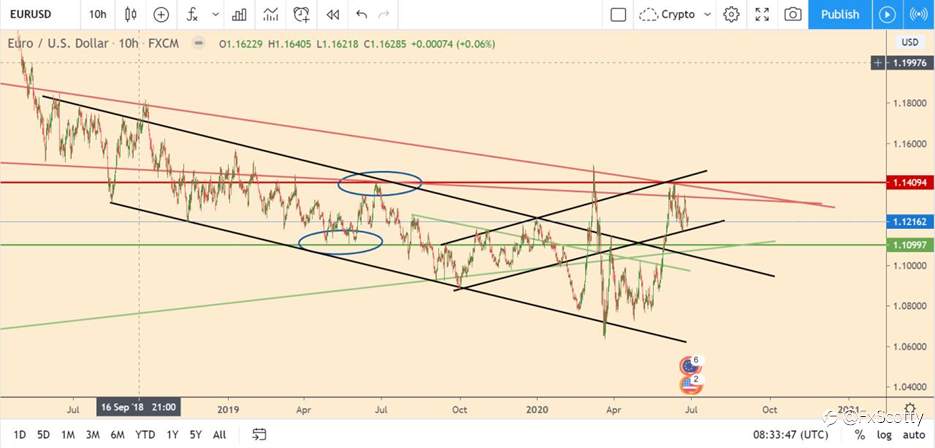
3. Open the chart on H8, draw the lines and levels in the same way, and then delete the unnecessary ones.
4. Important! It is necessary to analyze the chart on the h4-d1 timeframe since it is not necessary to trade for smaller timeframes (especially for a beginner)
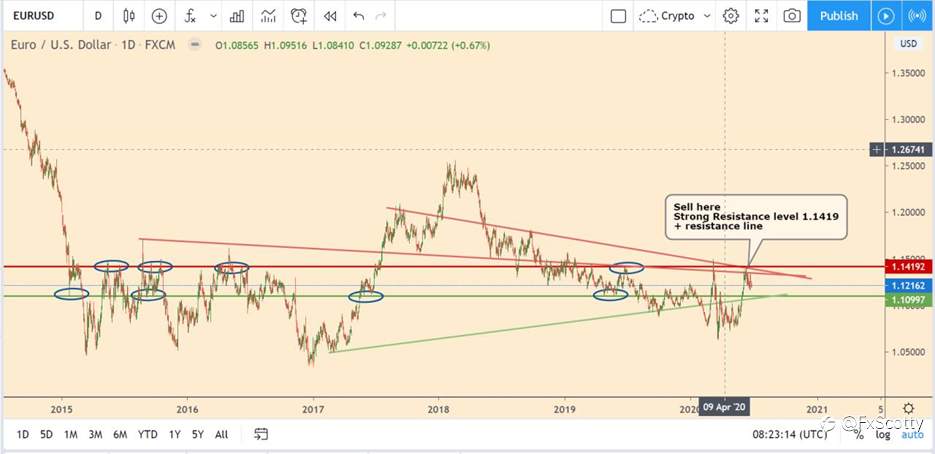
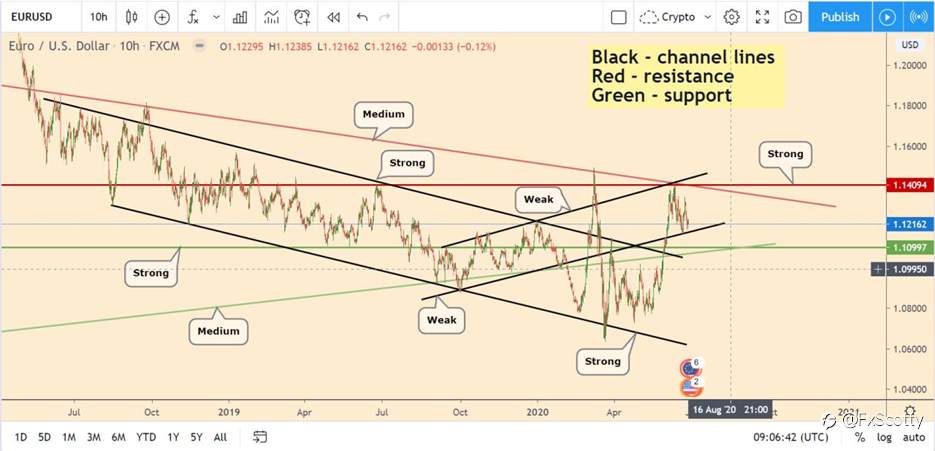
5. Identify which lines are strong, which are medium, which are weak (based on how many touches on the line)
Almost all lines on the D1 timeframe are strong (some may just be average)
The "strength" of a level depends on
1) the number of vertices that this level / line has built on.
2) From the timeframe on which this level / line is formed (Lines on the D1 timeframe are much stronger than the lines on the h1 timeframe)
------
Next, when everyone drew, we proceed to analyze the situation
!IMPORTANT! You can not consider each of the items separately, you need to collect all the information and then think about opening a deal or not.
1) We check that there is no news in the next 10 hours (if there is something, then do not trade)
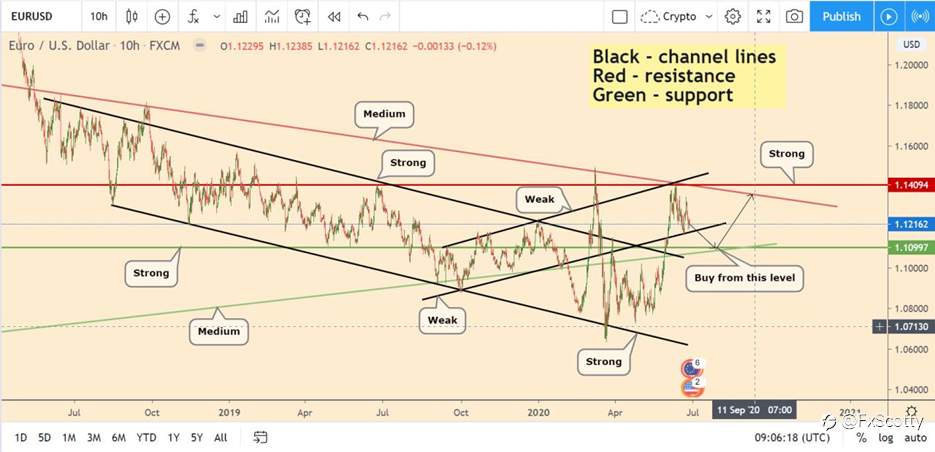
2) We look at what STRONG lines or levels the price has reached recently (If the price has reached a resistance level / line, it means that the price will continue to fall more. And the same is just the opposite with the support line).
3) If the price has broken through the STRONG level / support line, then the price is likely to continue the direction of the broken movement.
(In this situation, the price broke through the upper line of the falling channel that has been forming since 2018, which shows that purchases from strong lines / levels should be considered)
4) Enter the transaction STRICTLY from STRONG levels and lines.
5) Usually, if the price does not break the line / level, then the price will beautifully and definitely go in our direction, so SL set
5.1. For the next ADDITIONAL level / line which is nearby (in case there is an additional / supporting level / line next to the strong line / level)
Example:
We entered into deals from a strong resistance line when the price broke through this line. And SL put for an additional line.
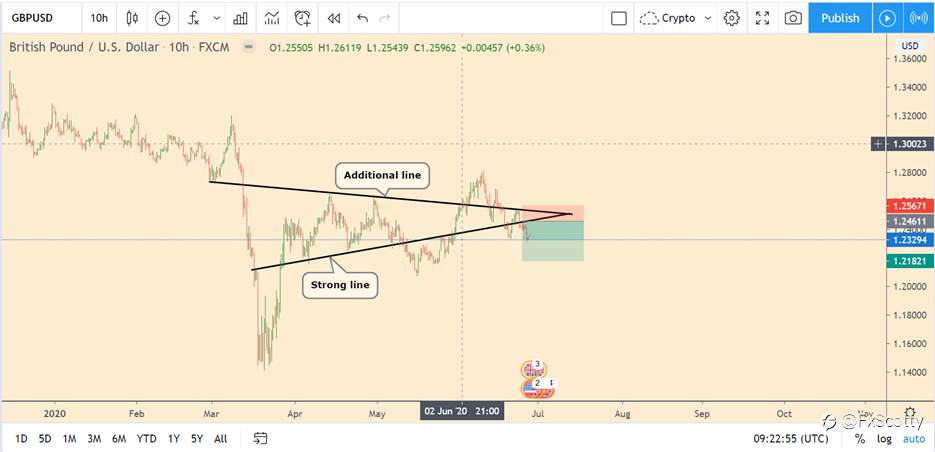
5.2 IF there is no additional level then put a stop loss at 70-80p from the entry point. (although usually there are additional levels and lines (you just need to look for them)
6. We take Take profit on the nearest STRONG / MIDDLE line / level.
The average ratio of SL and TP in my strategy is 1 to 2.5 (risk to reward ratio).
Edited 25 Apr 2021, 14:33
Disclaimer: The views expressed are solely those of the author and do not represent the official position of Followme. Followme does not take responsibility for the accuracy, completeness, or reliability of the information provided and is not liable for any actions taken based on the content, unless explicitly stated in writing.

Leave Your Message Now