· 阅读量 5,143
美国某知名机构曾经跟踪统计了长达7年的相关数据,最后通过大量的统计数据得出一个结论:在不低于75%的时间里,当天的价格会回到PIVOT中央价格线以上。专业的交易员都非常重视这样的研究成果,PIVOT数据是他们交易的重要依据,他们用此来分析重要的价格区域,成为寻找日间交易的重要工具。被欧美银行、对冲基金广泛的应用到期货、现货、股票和股指以及商品的交易之中。以现货汇率和汇率期货为例,在没有重大新闻的日间中,汇价70%—80%的时间是在Pivot 上下的R1到S1做区间波动,其中央枢轴点即PivotPoint。
我们首先需要有这样一个基本认知,枢轴点是指精确的价格,属于支撑和阻力价格,而非技术指标,准确的讲,其应该称之为价格指示器。
每一天,某一商品或者指数收市之后,相关的数据也就产生了,图表也即形成,常见的如烛图,柱图等。以蜡烛图为例,其日间的最高价,最低价,开盘价和收盘价成为了静态的数值,是反应了一天多空博弈的结果。
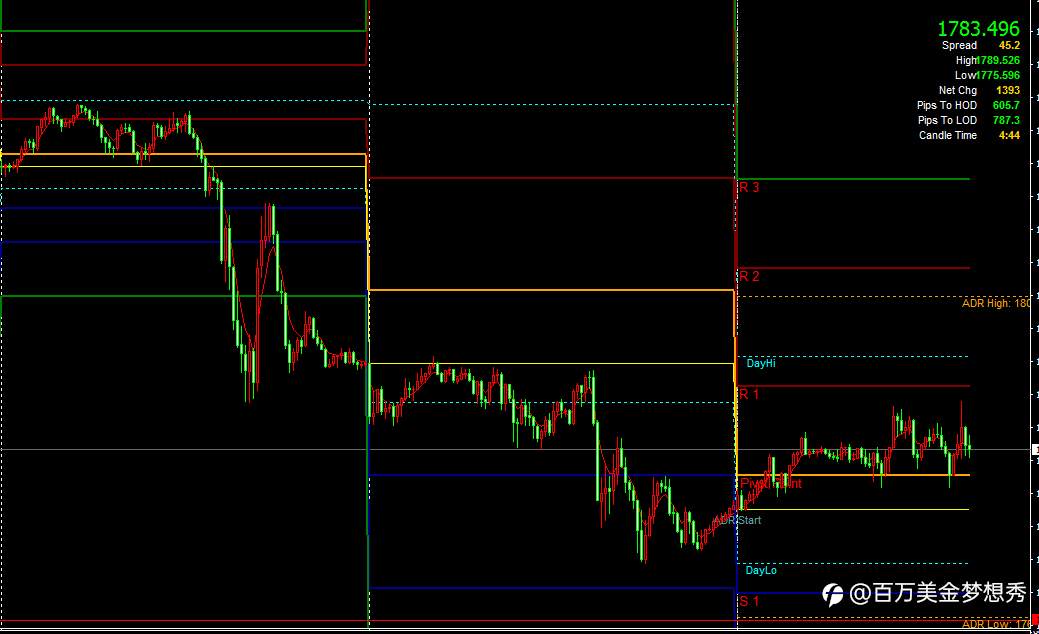
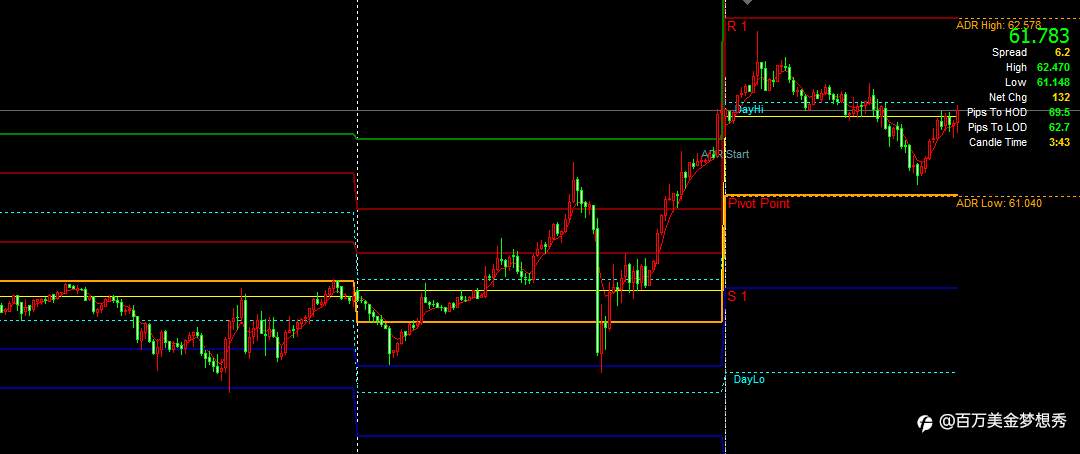
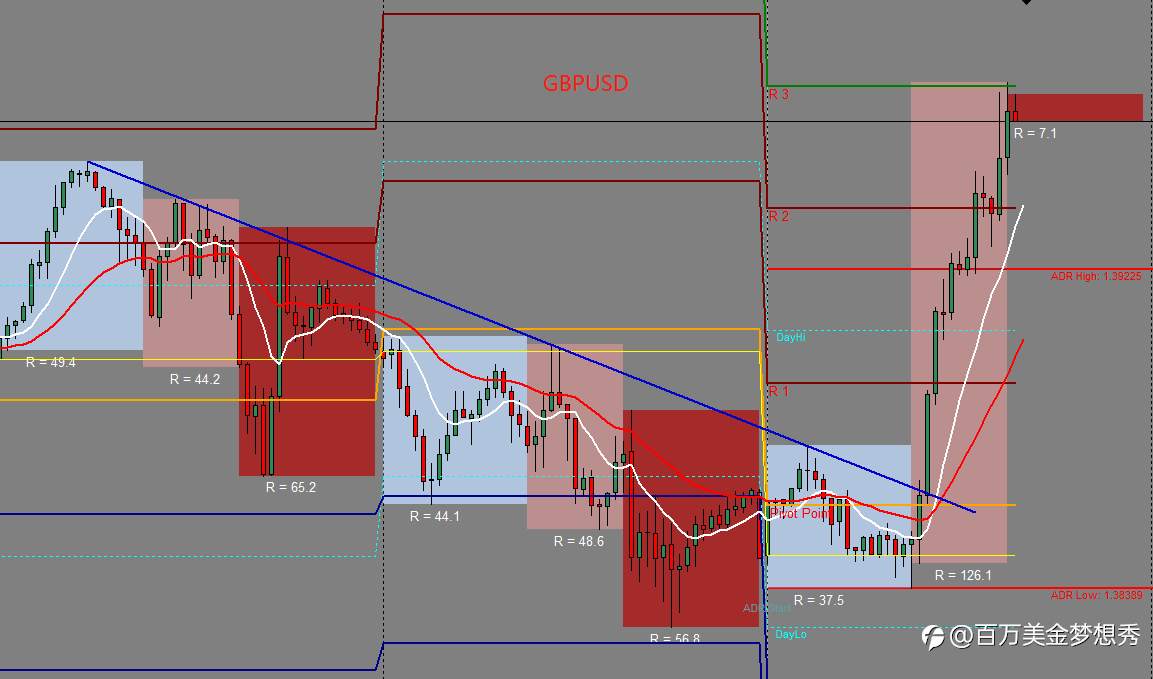
PivotPoint 指示器则是根据昨日的收市之后的数据,经自动计算得出高达7组价格。分别是三档支撑价格和三档阻力价格以及一个中心价格,即中央枢轴点。
这是本周三天的经典枢轴线图表,分别是黄金,原油和镑美。
风险提示:以上内容仅代表作者或嘉宾的观点,不代表 FOLLOWME 的任何观点及立场,且不代表 FOLLOWME 同意其说法或描述,也不构成任何投资建议。对于访问者根据 FOLLOWME 社区提供的信息所做出的一切行为,除非另有明确的书面承诺文件,否则本社区不承担任何形式的责任。
FOLLOWME 交易社区网址: www.followme.com
喜欢的话,赞赏支持一下


加载失败()