Market Overview
AUD/USD remains pressured below 0.7150 after disappointing Chinese activity data. RBA
jawbones on the exchange rate value. The market mood remains cautious amid coronavirus
concerns, US fiscal impasse and ahead of US-China trade talks.
Gold is down 4% on a week-to-date basis. The metal last suffered a weekly loss in early June.
Recovery in US yields looks to have pushed gold lower. Prices reached a record high of $2,075
last week.
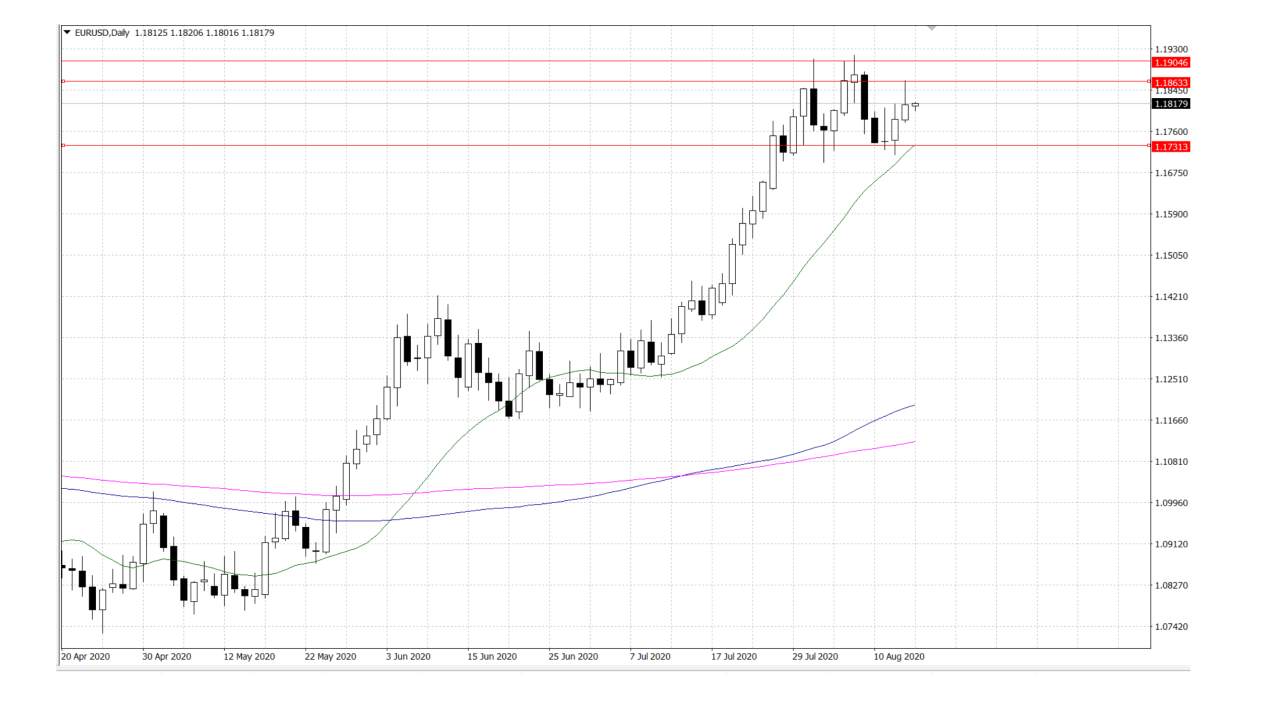
EUR/USD
Any subsequent positive move is likely to confront some resistance near the 1.1865 level. Some
follow-through buying has the potential to lift the pair back to the double-top resistance,
around the 1.1900-1.1910 region. A convincing breakthrough will be seen as a fresh trigger for
bullish traders and set the stage for a move towards reclaiming the key 1.2000 psychological
mark with some intermediate resistance near the 1.1980 region.
On the flip side, immediate support is pegged near the 1.1730 region where SMA 20 situates.
This is followed by the 1.1700 mark, which marks the neckline support of the double-top
pattern.
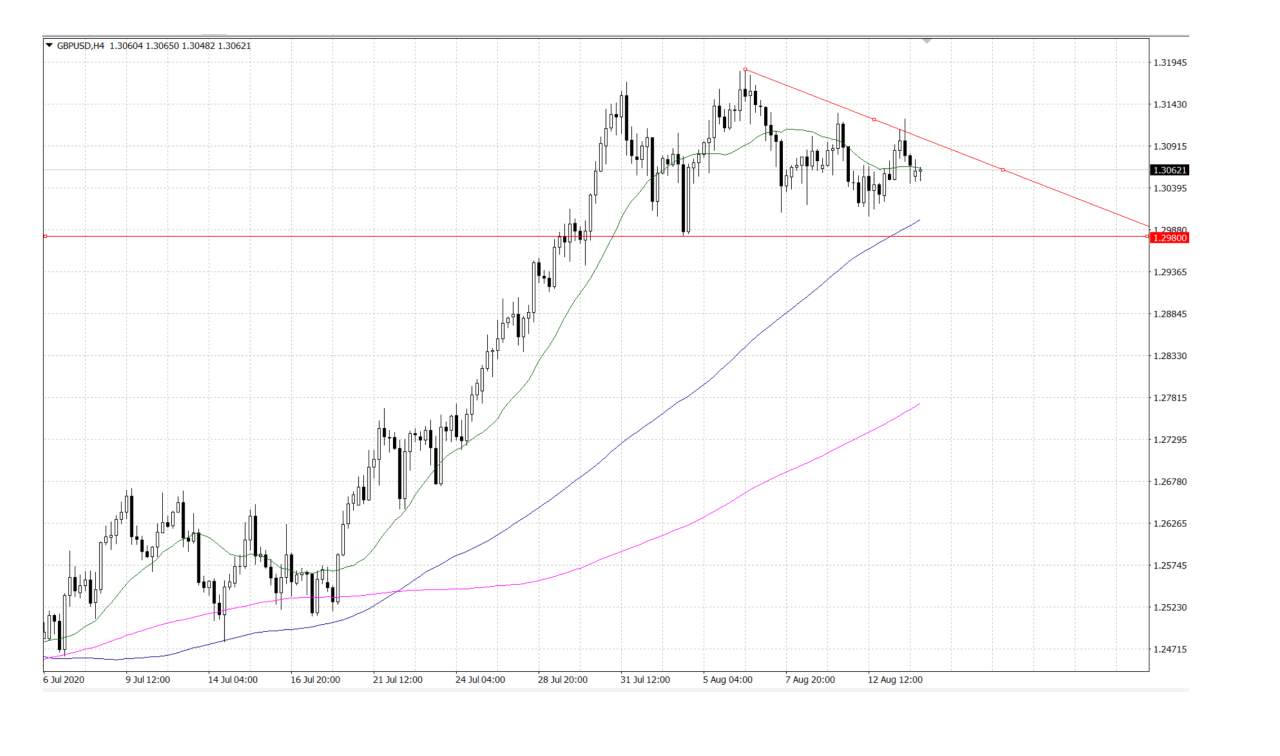
GBP/USD
The GBP/USD pair has lost its bullish potential according to intraday readings. The 4-hour chart
shows that the pair is now below the 20 SMA, which anyway lacks directional strength, yet above
bullish larger ones.
Technical indicators, in the meantime, have extended their declines within negative levels,
supporting a bearish extension in the upcoming sessions. At this point, the pair needs to break
below 1.2980 to confirm a bearish extension in the following sessions. The resistance awaits at
1.3100.
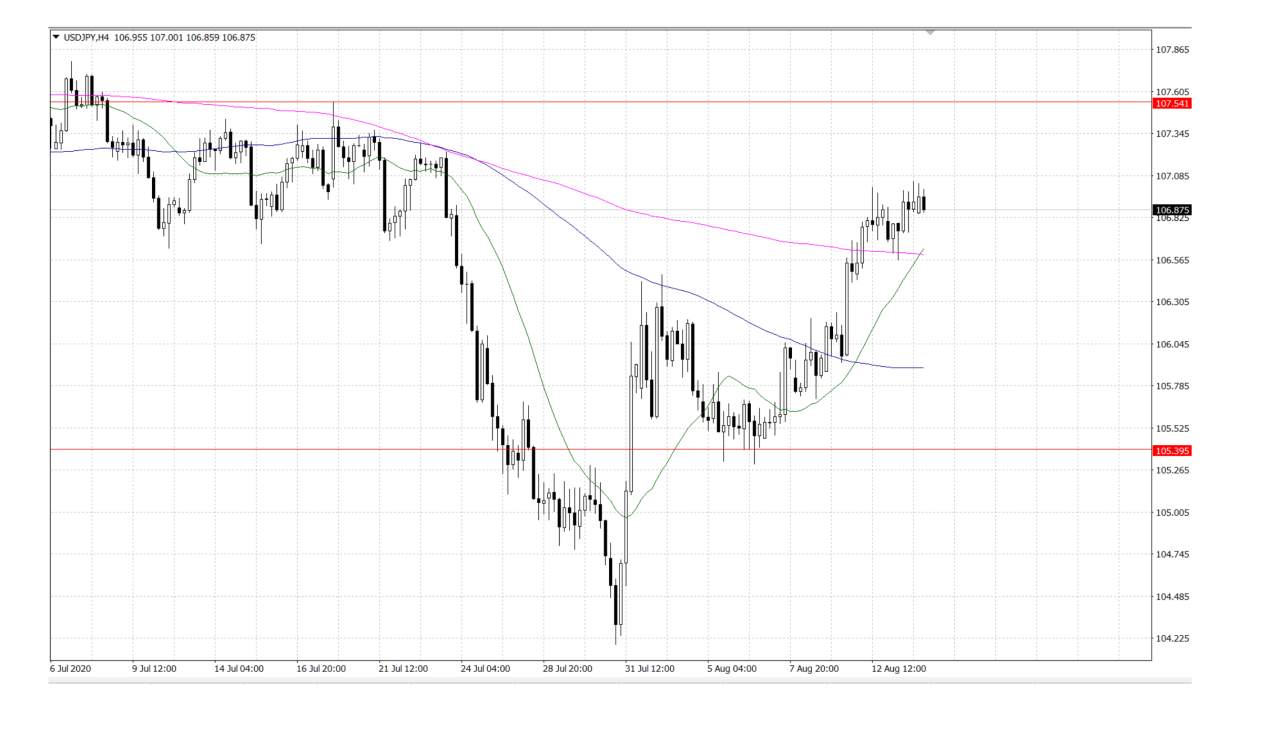
USD/JPY
The USD/JPY pair is bullish in the short-term and according to the 4-hour chart. The mentioned
timeframe shows that the intraday slide met buyers around a directionless 200 SMA, as the 20
SMA keeps advancing above the 100 SMA, now approaching the larger ones. Technical
indicators, in the meantime, turned higher, favoring a bullish extension in the near-term.
The support is near 105.40; while the pair has a resistance around 107.55.
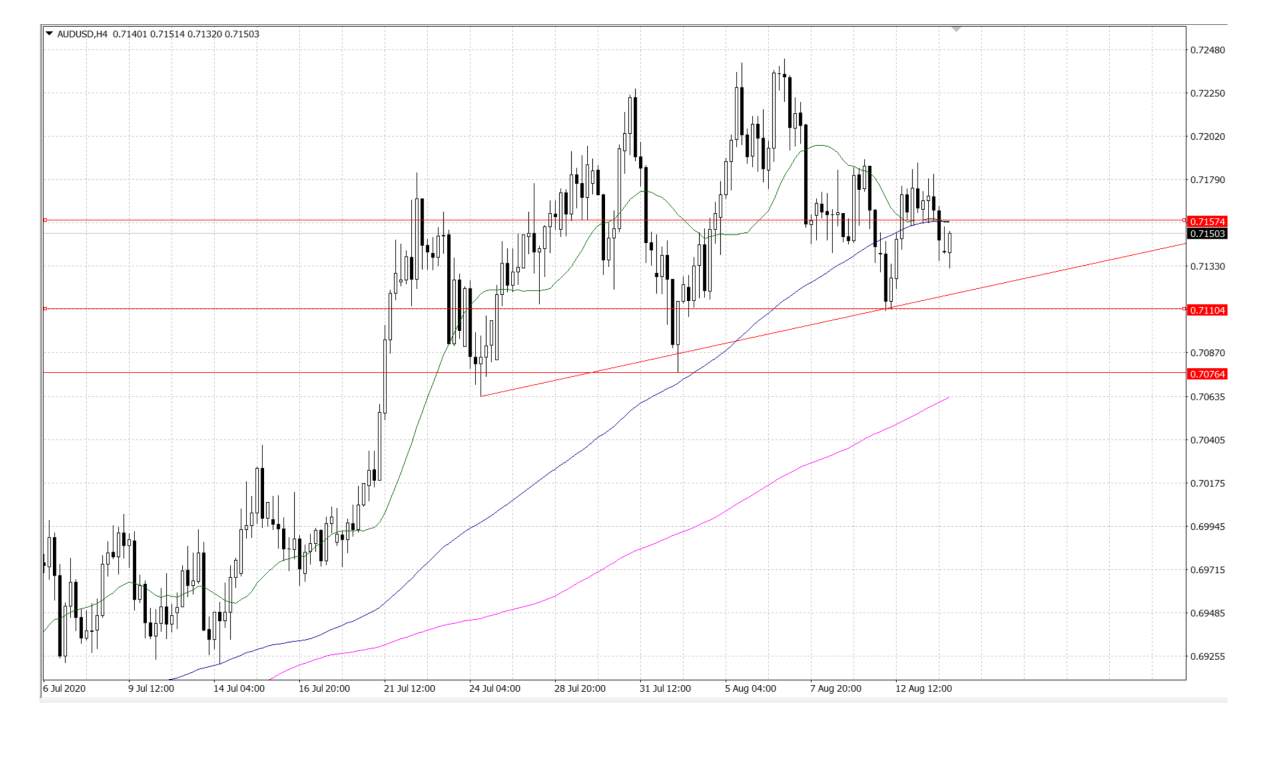
AUD/USD
The 4-hour chart for the AUD/USD pair shows that the pair has broken below its 20 and 100
SMA, both converging around 0.7160 and providing dynamic resistance.
Technical indicators, in the meantime, maintain their bearish slopes within negative levels,
anticipating a new leg south. The immediate support is the weekly low at 0.7110, followed by a
more relevant one at 0.7075.
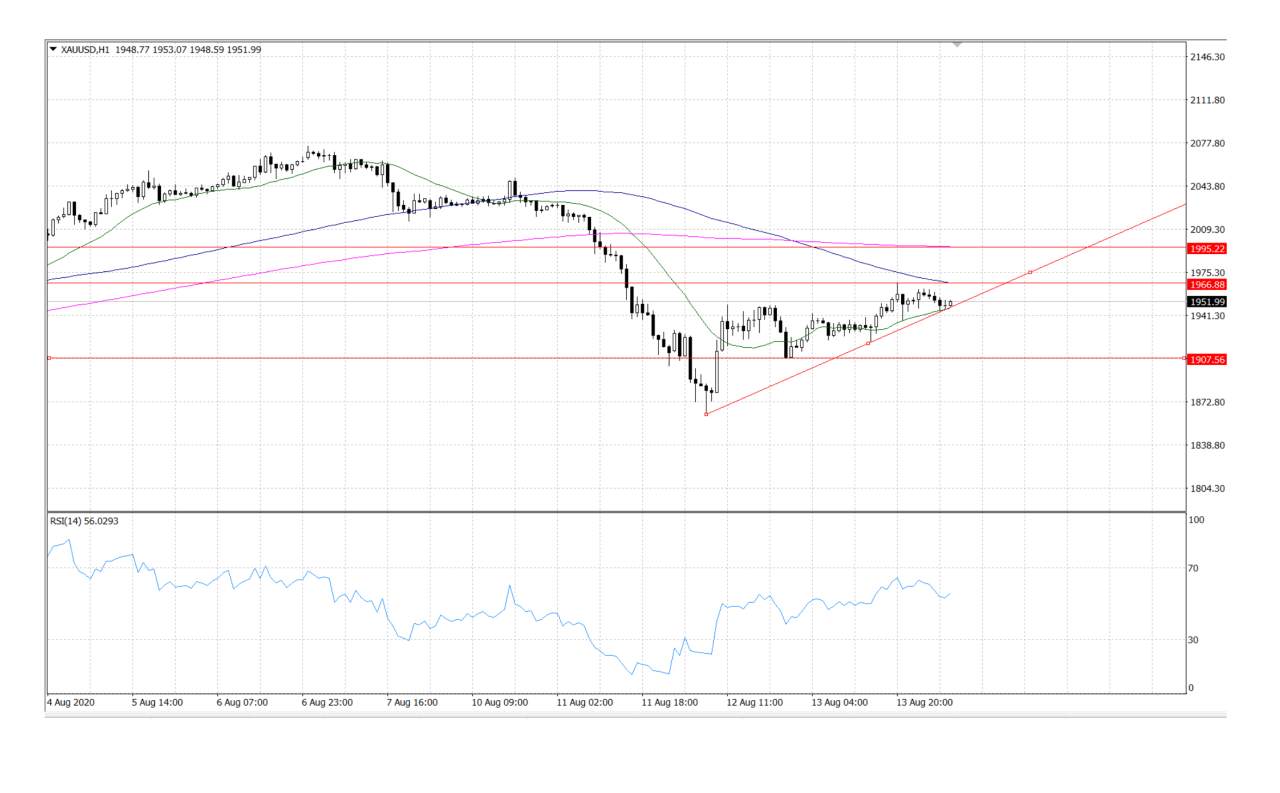
XAU/USD
XAU/USD ranges within a potential rising wedge formation on the hourly, clinging firmly onto the
solid support at $1,947, which the convergence of the rising trendline and upward-sloping 20
HMA. The hourly Relative Strength Index (RSI) inches slightly higher at 56, holding well above the
midline. This suggests that the price could bounce back to test the bearish 100 HMA at $1,967. A
fresh rally could be triggered on a break above the latter, opening doors for a test of the
horizontal 200 HMA barrier at $1,995.
To the downside, the bearish continuation pattern will get confirmed on an hourly closing below
the abovementioned critical support at $1,947. Sellers will then eye a test of $1,907 support on
its way to the round figure of $1,900.
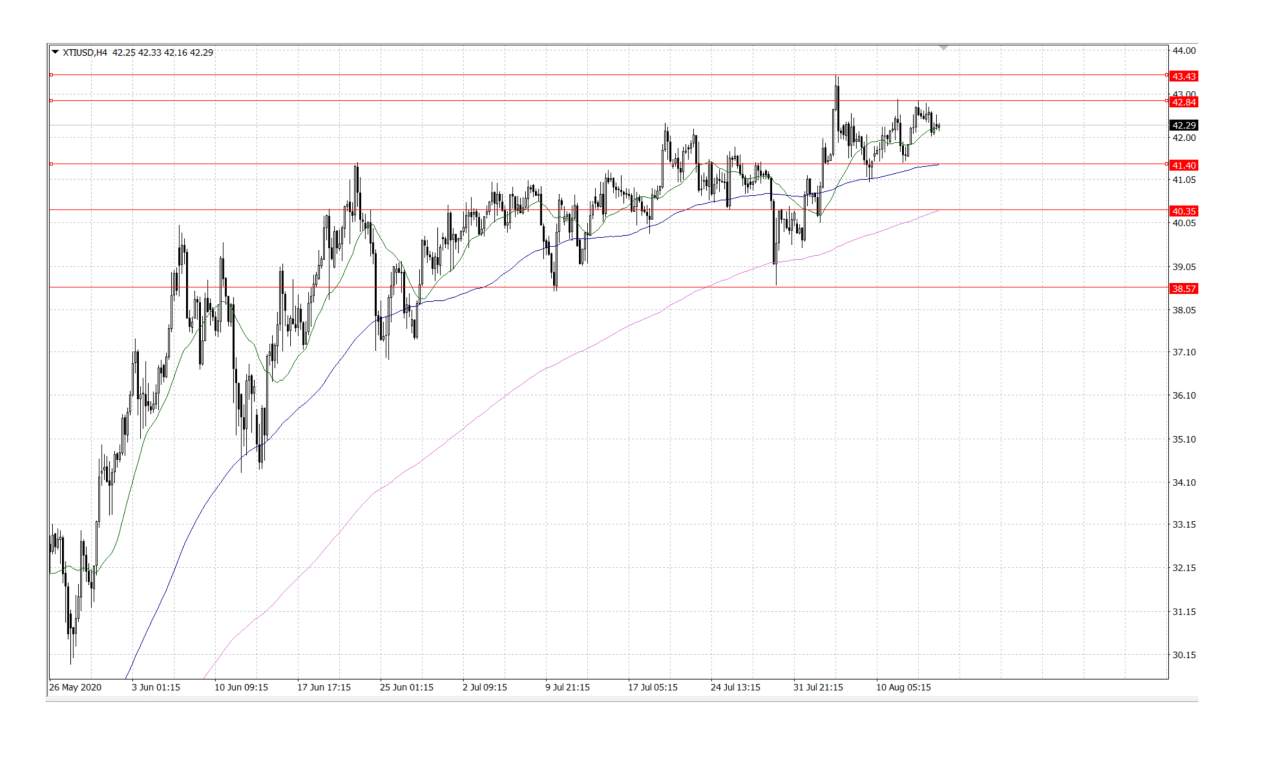
XTI/USD
The black gold’s further downside becomes doubtful amid upbeat RSI conditions, which if
ignored could propel the south-run towards SMA 100 at $41.40 and SMA 200 at $40.35.
Alternatively, the commodity’s sustained break of this week’s high, $42.85, will have to refresh
the monthly high of $43.42 before targeting the February month peak surrounding $44.00.
Disclaimer: The views expressed are solely those of the author and do not represent the official position of Followme. Followme does not take responsibility for the accuracy, completeness, or reliability of the information provided and is not liable for any actions taken based on the content, unless explicitly stated in writing.

Leave Your Message Now