
$50 Free Margin Account Campaign: https://china.nooralmal.com/cc...
EURUSD
The EUR/USD pair rose above 1.1300 on Wednesday and accelerated to the upside during the American session to hit its highest level in three weeks at 1.1351. The move was propelled by broad-based dollar weakness as, in the absence of first-tier economic data, investors took cues from equity markets, leaving aside concerns over the increase of COVID-19 cases in the United States to give way to moderate optimism.
During the European session, ECB’s Vicepresident Luis De Guindos expressed some optimism regarding the prospects for economic growth in the region on the back of the latest promising data releases. However, an agreement on the EU emergency fund remains elusive – with Austria, the Netherlands, Sweden and Denmark still opposing resistance – ahead of the leaders’ summit next week.
From a technical view, the EUR/USD pair has risen above a descending trendline coming from February 2018 high and looks set to extend gains toward the 1.1400-20 area, as indicators gain upward slope. June’s high at 1.1422 is the next hurdle to overcome en route to 2020 highs at 1.1497.
On the other hand, if the pair fails to hold above the mentioned trendline, it could lose upside potential and retreat to the 1.1255 area, where the 100-period SMA offers support. A break there could pave the way to the 200-period SMA at 1.1215.
Support levels: 1.1270 1.1255 1.1215
Resistance levels: 1.1350 1.1400 1.1422

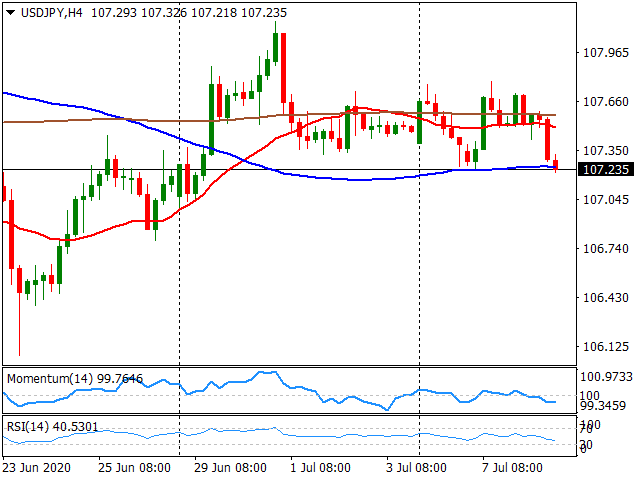
USDJPY
The dollar lost ground against the yen on Wednesday, and even though USD/JPY printed a marginally lower low at 107.20, it continues to trade within its recent range, gravitating around the 107.50 level and unable to set a short-term direction. The pair tested support at the 20-day SMA – as dollar weakness was the theme of the day – but it lacked the momentum to break below it.
The short-term technical picture for USD/JPY ranges from neutral to slightly bearish as per indicators in the 4-hour chart. From a broader perspective, USD/JPY continues to trade in a rather narrow channel bounded by the 20-day SMA on the downside, currently at 107.20, and the 100-day SMA on the upside, now at 107.75. A break of either one of these levels could trigger a more substantial movement in that direction. On the downside, the next target would be at 106.80, Jun 26 low. On the upside, the next barrier stands at 108.35, where the 200-day SMA lies.
Support levels: 107.20 106.80 106.60
Resistance levels: 107.95 108.35 108.65
GBPUSD
The GBP/USD pair advanced for the fourth day in a row on Wednesday, climbing above 1.2600 to reach its highest level since Jun 16 at 1.2620, amid dollar weakness and despite the lack of progress in Brexit talks. On Tuesday, UK Prime Minister Boris Johnson reportedly told German Chancellor Angela Merkel that Britain is ready to end the transition period (Dec 31, 2020) without a deal if the EU is not willing to compromise. No major data releases are due on Thursday.
As for the technical outlook, Cable holds a short-term bullish bias, although it could go through a phase of consolidation as the RSI approaches overbought levels. Meanwhile, the price trades well above its main moving averages as it consolidates near three-week highs. If the GBP/USD breaks decisively above 1.2620, it could approach the 1.2690 zone in the upcoming sessions where the 200-day SMA could offer stiff resistance. On the flip side, supports are seen at 1.2520, 20-period SMA in the 4-hour chart and 1.2480, 200-period SMA.
Support levels: 1.2520 1.2480 1.2440
Resistance levels: 1.2620 1.2690 1.2730

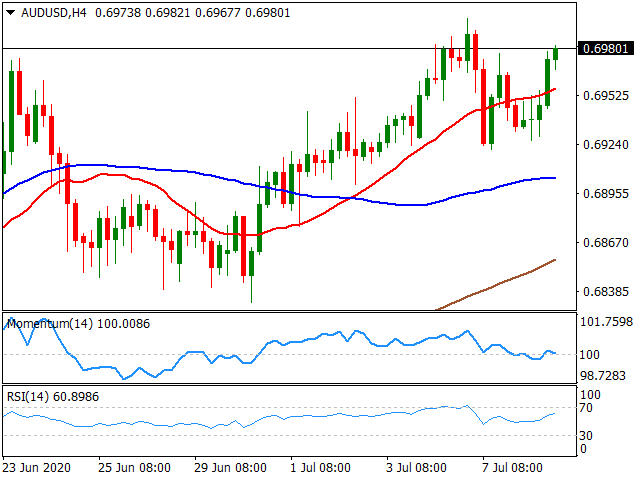
AUDUSD
The AUD/USD pair edged higher and closed Wednesday at daily highs, underpinned by the relentless selling in the US dollar against its main competitors. A better market sentiment, as well as stocks gains, extended support to the perceived riskier Australian dollar. However, the upside remained limited on concerns that renewed lockdown measures in Australia could slow down the economic recovery.
The AUD/USD technical picture has improved according to the 4-hour and daily indicators, although gains seem limited as long as the Aussie holds below the 0.70 mark. The daily high set at 0.6982 is the immediate resistance to overcome ahead of the 0.7000 psychological level. A break here could pave the way to more gains with the 2020 peak of 0.7064 in sight. On the opposite side, a loss of the 0.6900 level, 100-period SMA in 4-hour chart, could exert pressure on the pair and send it to the 0.6875 area, en route to 0.6855, 200-period SMA.
Support levels: 0.6960 0.6900 0.6855
Resistance levels: 0.7000 0.7030 0.7064
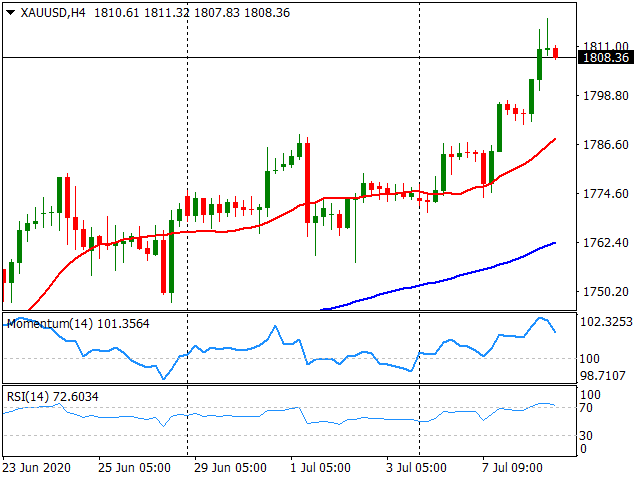
GOLD
Gold finally broke its resistance at 1.800$ with a decisive move on Wednesday. The latest move up carried Gold to 1818$ which was last seen in September 2011. In the long run, coronavirus pandemic driven extreme-easy monetary policies created the perfect conditions for Gold prices to rally. Also, as a natural result of those policies, the USD is getting weaker day by day as DXY once again slid below 97.00 level to mid-96.00. While the yellow metal is supported by the current market conditions, also, the direction of the coronavirus pandemic is far from over. After a series of easings, the number of cases started to emerge immediately forcing governments to re-impose some of the lockdown measures. Therefore, Gold will most likely keep its advance in current market conditions while the only setback is better than expected data readings around the globe.
Technically speaking, last time when Gold was at 1.800$ levels, policy rates were four times than the current ones, S&P was ⅓ and Nasdaq was ⅙ of Gold prices. Therefore, Gold will likely have a room for advance. If Gold prices will continue to stay over 1.800$ decisively, the next target might be followed at 1.825$ (2011 August close), 1.900$ and 1.922$ (all-time high). Below the 1.800$ level, the supports can be followed at 1.750$(December 2012 peak) and 1.738$ (April double top).
Support Levels: 1.800$ 1.750$ 1.738$
Resistance Levels: 1.825$ 1.900$ 1.922$
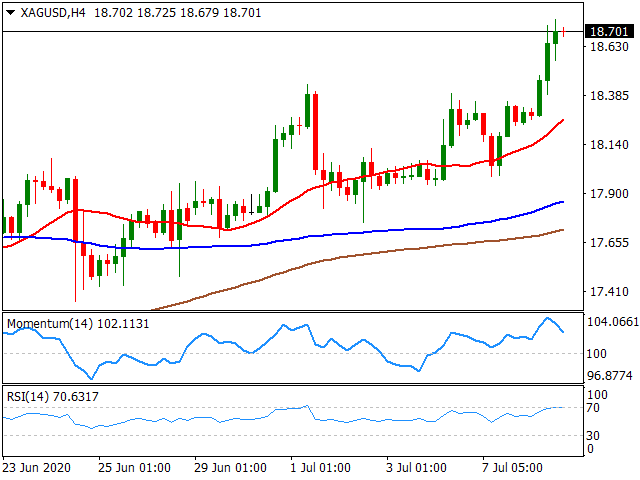
SILVER
Silver managed to follow the Gold rally on Wednesday and tried to test 19.00$ resistance. However, the move stayed short of the 19.00$ level the white metal found balance around 18.70$ level. The latest COT data for Silver signalled that the net overall rose by 22% to 36k lots. Also, in the aftermath of the latest move, Gold to silver ratio rebounded to 98.00 level.
If Silver stays over the important 18.38$ decisively the next resistances can be followed at 18.70$, 19.00$ and 19.64$(September 2019 high). Below the 18.38$ level, the supports can be seen at 18.00$, 17.60$, which is the %38.20 level of 14.29$ and 16.97$ (%50.0 14.29$-19.65$).
Support Levels: 18.38$ 18.00$ 17.60$
Resistance Levels: 18.70$ 19.00$ 19.64$
DOW JONES
Dow Jones tried its best to keep its advance as the index is wobbling around 26.000 levels. Due to the report published by the John Hopkins hospital, the last seven day’s increase in new coronavirus cases is the double of the last fourteen days in the US. As the number of cases is inclining, some states are getting ready to re-impose lockdown measures. At this point, the investors are betting on that there will be no lock-down of the economy which was also stated by Trump despite the number of new cases is only going worse. Also, as the economic activity is on, the macro data sets are signalling a V-shaped recovery.
Below the 25.000 level, 24.719 (21.712-29.585 %61.80) 23.500 and 23.000 levels can be followed as support levels while a steady close over 25.667 (21.712-29.585 %50) will most likely to carry Dow Jones to 26.000, 26.577 (21.712-29.585 %38.200) and 27.000 levels.
Support Levels: 25.000 24.719 23.500
Resistance Levels: 26.000 26.577 27.000

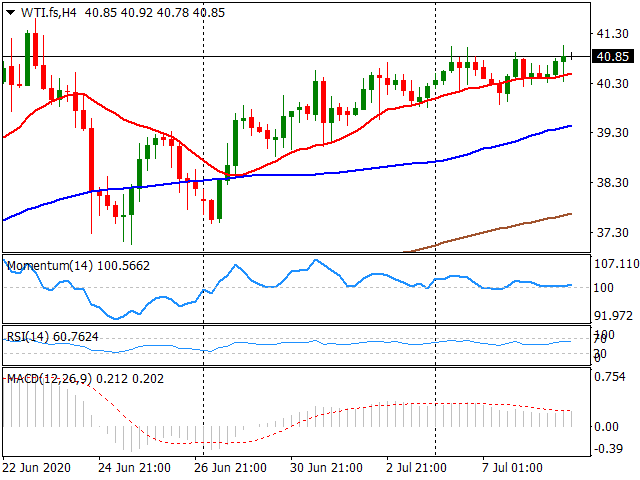
WTII
WTI managed to stay over the 40.00$ barrier as this level was highly defended since early June. As the USD index, DXY retreated below 97.00, WTI tested 41ç00$ level intraday but failed to stay above the physiological level. The US crude inventories rose by 5.7 million barrels in the week to July 3, compared with expectations for a decrease of 3.1 million barrels based on the data published by the Energy Information Administration (EIA). The cautious positive sentiment is driving the markets at the moment while Wall Street is trying to keep its move up, Gold also rallying along with the fear of the second wave of coronavirus pandemic.
A decisive move over 32.81$ (65.62$-0.00$ %50) might carry WTI to 40.56$ (65.62$-0.00$ %61.80), 50.00$ and 54.00 levels. Below the 32.81$ level, 31.00$, 27.40$ (9th of March dip) and 26.00$ levels can be targeted.
Support Levels: 31.00$ 27.40$ 26.00$
Resistance Levels: 40.56$ 50.00$ 54.00$
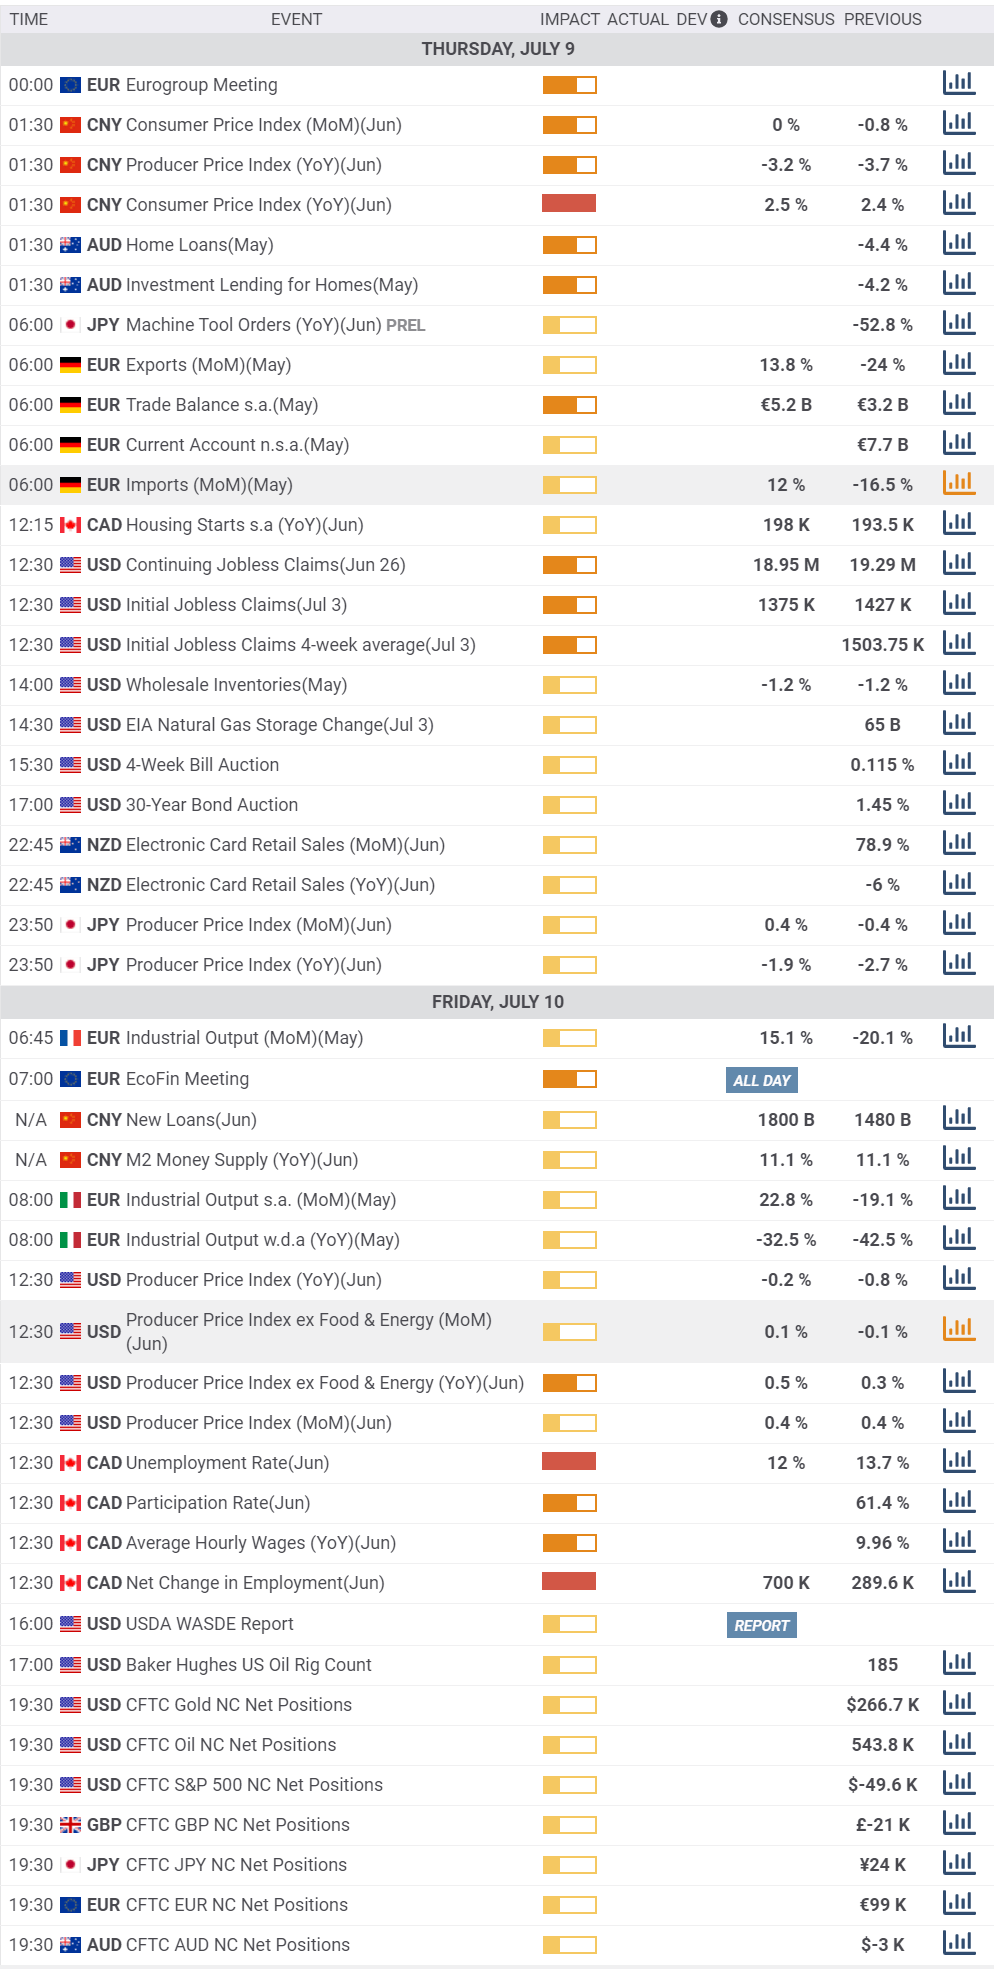
MACROECONOMIC EVENTS
* All the Moving Average support and resistance levels are dynamic by nature. Means when the price approaches the Moving averages, slight variation occurs in the forecasted Moving Average support and resistance levels. Previous few days’ intraday levels are also signicant while trading the current day as the price tend to hover around these levels for some time. Levels in red indicate strong, critical or vital.
Please remember that trading financial markets carry a high degree of risk to your capital. It is possible to lose more than your initial stake. Leveraged products may not be suitable for all investors, therefore please ensure you fully understand the risks involved and seek independent advice if necessary.
All Rights Reserved © Noor Al Ma
#外汇市场影响因素##外汇资讯##黄金突破1800##英央行决议对英镑会有何影响##如何看待这一轮原油暴跌#
Edited 09 Jul 2020, 09:06
Disclaimer: The views expressed are solely those of the author and do not represent the official position of Followme. Followme does not take responsibility for the accuracy, completeness, or reliability of the information provided and is not liable for any actions taken based on the content, unless explicitly stated in writing.

Leave Your Message Now