指标解析:
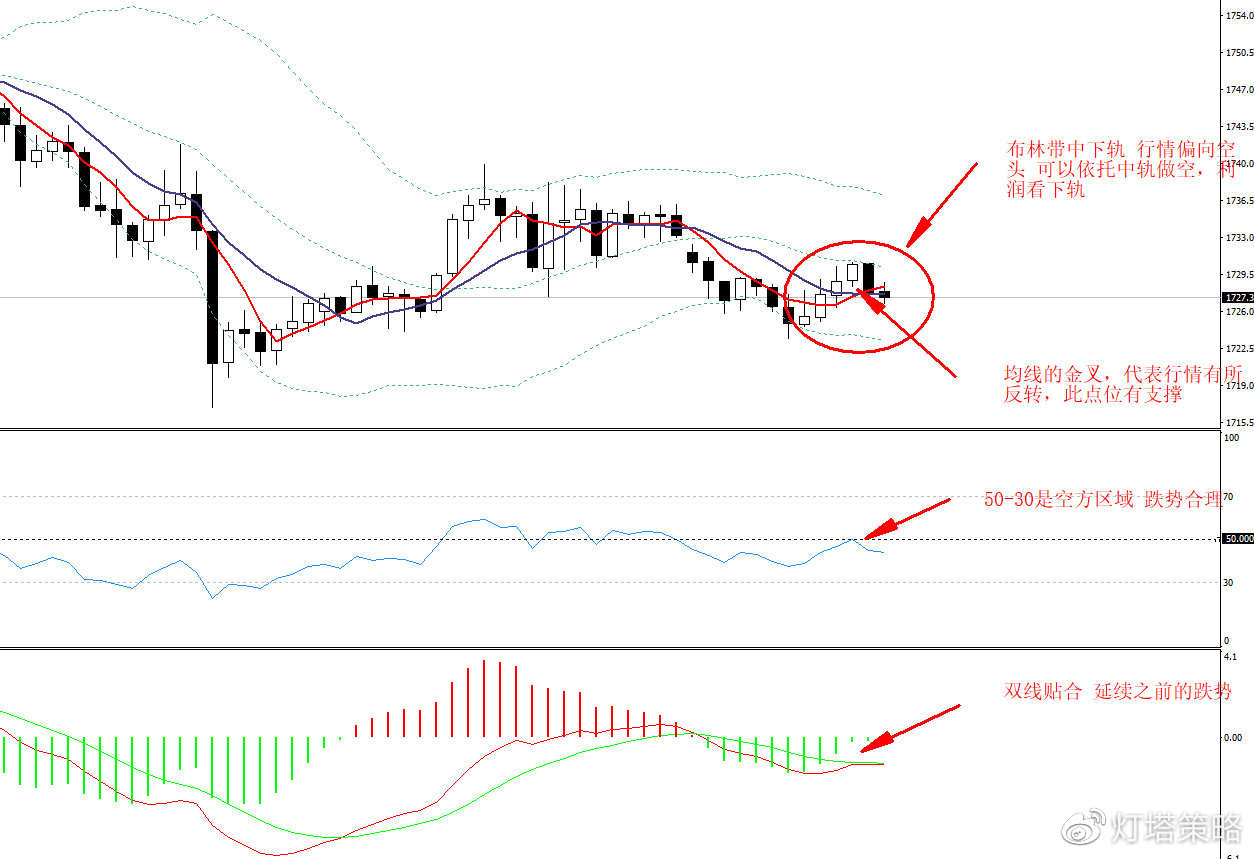
通常我们把保加利通道(布林带)当作一个区间指标使用,因为它的走势完全贴合当前蜡烛走势,我个人习惯使用的布林带周期为20日。目前行情处于布林带的中下轨波动,那么中轨的1731就是短期的阻力位,下轨的1723就是支撑位。整个布林带的开口向下,也反映市场的变化更偏向于空头行情。
当对行情不确定情况下,我们可以看一下相对强弱指标(rsi),来判断多空的强弱指数,是否和布林带呈现的走势保持一致,谨防被行情诱空,或者诱多。Ris目前处于50下方,空头略占上风,亚盘的下跌没有导致ris 出现超卖现象,证明跌势是合理的。
整个跌势保持合理的状态下,我们来看一下趋势,我个人比较喜欢用短周期均线5日快线,以及10日慢线。慢线承压下移,证明行情还是处于回落状态,下午欧盘快线贯穿慢线在1727形成金叉,有明显的上扬,空头暂时得到了压制。
图表所述:红色为快线5日均线,紫色为慢线10日均线。
Macd现在处于0轴下方负值区,虽有出现负值区金叉,但是并未成功突破0轴,绿色动能柱持续放量,双线目前属于在负值区的贴合状态,证明空头将会持续延续。
综上所述:
当前处于低位盘整,下方有效支撑1721-1711-1706破位可追
上方阻力 1727-1733-1738 未破1721之前 低多为主。

Disclaimer: The content above represents only the views of the author or guest. It does not represent any views or positions of FOLLOWME and does not mean that FOLLOWME agrees with its statement or description, nor does it constitute any investment advice. For all actions taken by visitors based on information provided by the FOLLOWME community, the community does not assume any form of liability unless otherwise expressly promised in writing.
FOLLOWME Trading Community Website: www.followme.com


Load Fail()