Matt, a trend trader who specializes in foreign exchange and stocks, said knowing how to disassemble and analyze price charts is the key to trading technology. Of course, the psychological aspects of trading are also crucial.
This article will show you how Matt, as a professional, does his daily analysis as a trend trader, just to your reference.
1. Analysis of higher time frames
I start with a monthly time frame. During this time frame, I will see if the price is in a consolidation or trending state. If the price is consolidating within the monthly time frame, I will not trade with this chart.
If a trend is revealed on the monthly chart, then I will see if there are significant monthly support or resistance levels near the current price. This includes pivot points and previous years' highs and lows and closing prices.

I also look at the annual time frame to find any significant annual pivot points close to the price. If there is no upcoming support or resistance in the direction of the trend, then I will turn to the weekly time frame.
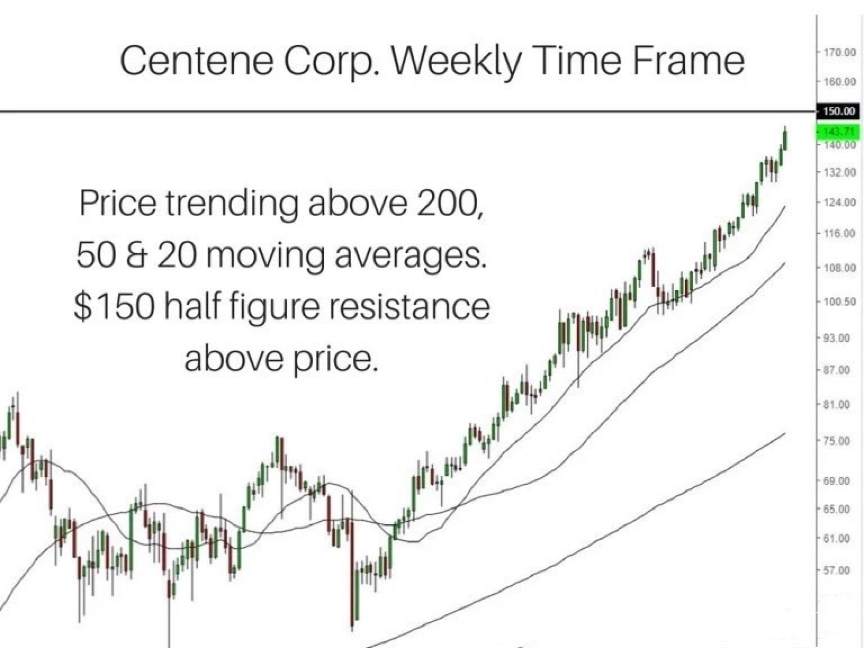
2. Weekly time frame
Within the weekly time frame, I look for weekly trading deviations. To this end, I will evaluate whether the price is above or below the 200-week moving average. If it is higher, it is bullish, or instead, bearish. However, this must be consistent with the daily time range.
The 50-week moving average will tell us the weekly trend. If it is above the 50-week moving average, it may be in a bullish trend and lower than a bearish trend. The 20-week moving average will give me a better understanding of the linear measure of the weekly trend. If the price stays above 20, I think there may be a strong linear bullish trend. The bear market is the opposite.
Again, I will see if there are weekly support or resistance levels near the price. Buying below resistance is not feasible.
Finally, if I were to trade stocks, I would use a weekly time frame to assess whether a particular stock exceeded the performance of the entire market.
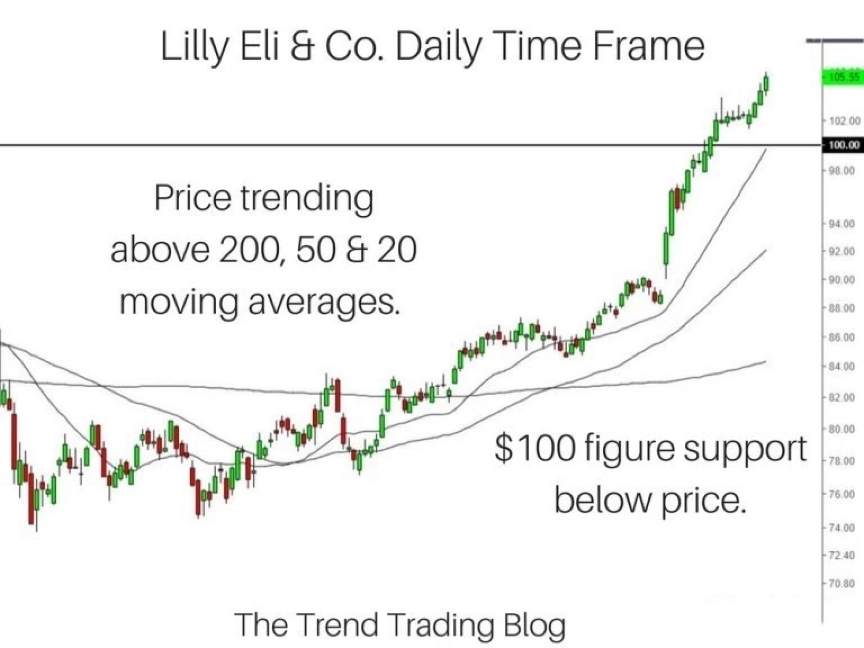
3. Daily time range
If everything looks good within the monthly and weekly time frames, then I would not look at the daily time frame. I will not use any analysis below the daily time range.
First, I check if the price is above or below the 200-day moving average. Above this level, I look for long-term opportunities. If it is lower, I will look for short-term opportunities. As mentioned above, for long trades, the price must be above the weekly and daily 200 moving averages.
Next, I see if the price has been above the 50-day moving average. If anything, it is likely to become a trend. A price consistently above the 20-day moving average may mean that the strength and linearity of the trend is very good.
After looking at the moving averages, I will look at the price movement itself and any chart patterns related to my analysis. I use this analysis to evaluate how prices behave within their trends.
How deep is the callback? Is the correction supported in an uptrend? By analyzing the price trend, I can conclude whether to look for a pullback or break into the market.
4. Additional analysis
When I have a valid trading setup, I will use some additional analysis to support my analysis and filter out unlikely settings. These include market trading volume, bullish or bearish patterns of candlesticks, and current price momentum.
Finally, never set unrealistic trading goals
I often hear new traders say that their trading goal is to get a 5% return on investment every week, or 10% every month. These types of goals are not realistic but counterproductive.
I'm a long-term trend trader, which means I usually make money regularly. I may make a good profit for a period of time, and then I may make money for only a few months a year, and nothing else. This may be seen as a disadvantage of trend trading, but I think its benefits far outweigh the disadvantages.
Therefore, setting a fixed profit or percentage target weekly or monthly is not a good idea. Assuming the market is sluggish, I may not make a lot of money for a while or not at all. But I will eventually reach my goal.
In addition, my goal is to double the capital every 3-5 years. This is a longer-term thing, and there is enough space and time for me to stay quiet and consolidated in the market. If I don't do anything for a year or two, that's only part of the process.
Edited 25 Feb 2020, 17:42
Disclaimer: The views expressed are solely those of the author and do not represent the official position of Followme. Followme does not take responsibility for the accuracy, completeness, or reliability of the information provided and is not liable for any actions taken based on the content, unless explicitly stated in writing.

Leave Your Message Now