The first thing you should know about Fibonacci instruments is that it works best in a trending forex market.
The idea is to go long (or buy in) at the Fibonacci support level when the market goes up and go short (or sell) at the Fibonacci resistance level when the market goes down.
Fibonacci retracement levels are considered a predictive indicator as they are used to try to determine what the future price is likely to be.
According to the theory, after the price starts a new trend direction, the price will pull back or partially return to the previous price level, and then recover in the trend direction.
Find the Fibonacci Retracements
In order to find these Fibonacci retracement levels, you must find the important swing highs and swing lows in recent fluctuation.
Then, for a downward trend, click on the swing high and drag the cursor to the nearest swing low.
For upgoing trends, just do the opposite. Click the swing low and drag the cursor to the nearest swing high.
Understand?
Now, let's look at some examples on how to apply Fibonacci retracement to the currency market.
Upgoing trends
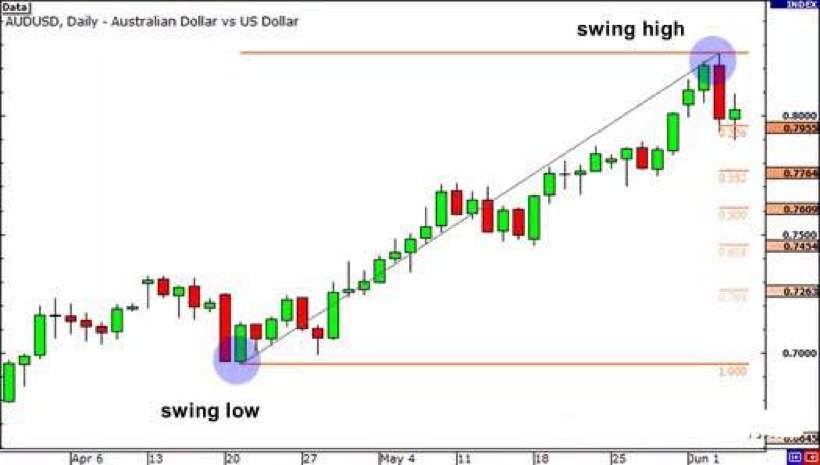
AUD/USD Daily Chart
Here, we plotted the Fibonacci retracement level by clicking the swing low at 0.6955 on April 20 and the swing high of 0.8264 on June 3.
This software will magically show you the retracement level. From the chart, Fibonacci retracement levels are:
0.7955(23.6%)、0.7764(38.2%)、0.7609(50.0%)、0.7454(61.8%)和0.7263(76.4%).
The current expectation is that if the AUD / USD retreats from its recent swing highs, support will be found at one of the Fibonacci retracements, as traders will place orders at these prices as prices fall.
Now, let's see what happens after the swing high.
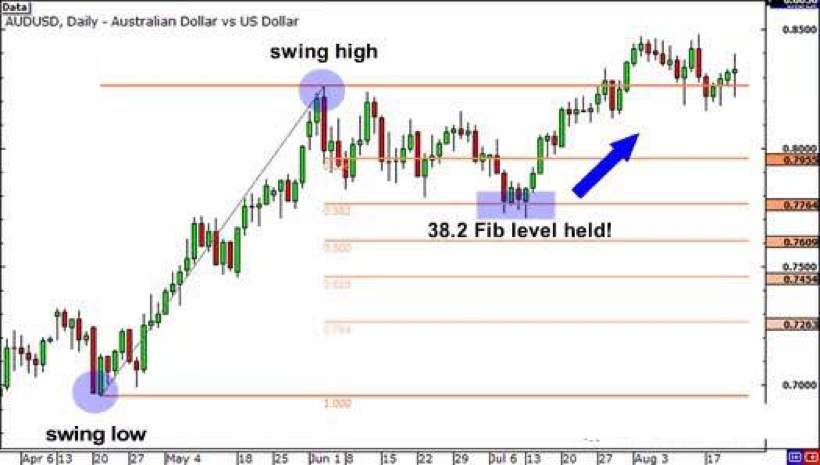
Prices fell back to the 23.6% level and continued to fall in the coming weeks.
It even tested the 38.2% level but failed to close below that level.
Later, around July 14th, the market resumed its upward trend and eventually broke through the swing high.
Obviously, buying at the 38.2% Fibonacci level will be a profitable long-term trade!
Downward trend
Now let's have a look at how to use the Fibonacci Retracement Tool in a downward trend. Below is a 4-hour chart of EUR / USD.

EUR / USD 4-hour chart
As you can see, the swing high was at 1.4195 on January 25, and a few days later on February 1 the swing low can be found at 1.3854.
Retracements are 1.3933(23.6%)、1.3983(38.2%)、1.4023(50.0%)、1.4064(61.8%) and 1.4114(76.4%).
The expectation of a downward trend is that if the price falls back from this low, it may encounter resistance at a certain level in the Fibonacci sequence, because traders who want to capture the downtrend at a better price may be ready Sold out.
Let's see what happens next.
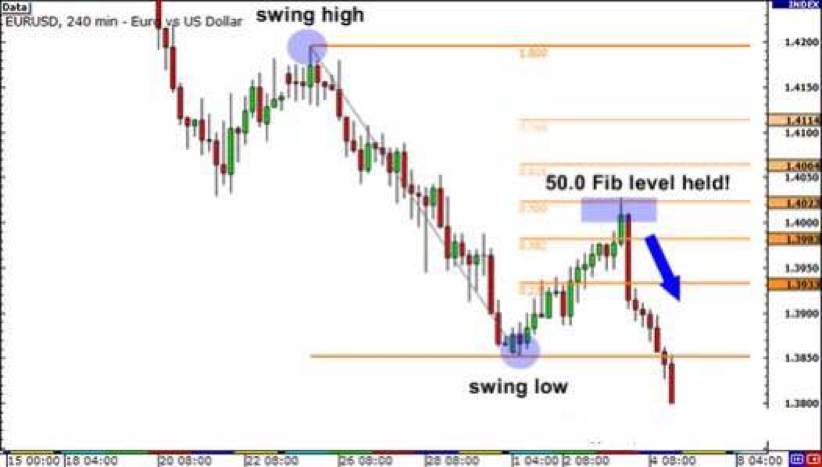
The market did try to rebound, stalling for a while below the 38.2% level before testing the 50.0% level.
If you have some orders at the 38.2% or 50.0% level, you will make some crazy trades.
In both examples, we see that the price found some temporary foreign exchange support or resistance at the Fibonacci retracement.
Because of all the people using Fibonacci tools, these levels become self-fulfilling levels of support and resistance.
If there are enough market participants who believe that a pullback will occur near the Fibonacci retracement level and wait for a position to be established when the price reaches that level, then all these pending orders may influence market prices.
One thing you should be aware of is that prices do not always bounce from these levels.
Now, there are some things you should always remember about using Fibonacci tools, and they are not always easy to use!
If it were that simple, traders would always place orders at the Fibonacci return and the market would always move in this direction.
Disclaimer: The views expressed are solely those of the author and do not represent the official position of Followme. Followme does not take responsibility for the accuracy, completeness, or reliability of the information provided and is not liable for any actions taken based on the content, unless explicitly stated in writing.

Leave Your Message Now