| Scenario | |
|---|---|
| Timeframe | Weekly |
| Recommendation | SELL STOP |
| Entry Point | 937.50 |
| Take Profit | 906.25, 890.62 |
| Stop Loss | 962.00 |
| Key Levels | 890.62, 906.25, 937.50, 968.75, 1000.00, 1031.25 |
| Alternative scenario | |
|---|---|
| Recommendation | BUY STOP |
| Entry Point | 968.80 |
| Take Profit | 1000.00, 1031.25 |
| Stop Loss | 943.00 |
| Key Levels | 890.62, 906.25, 937.50, 968.75, 1000.00, 1031.25 |
Current trend
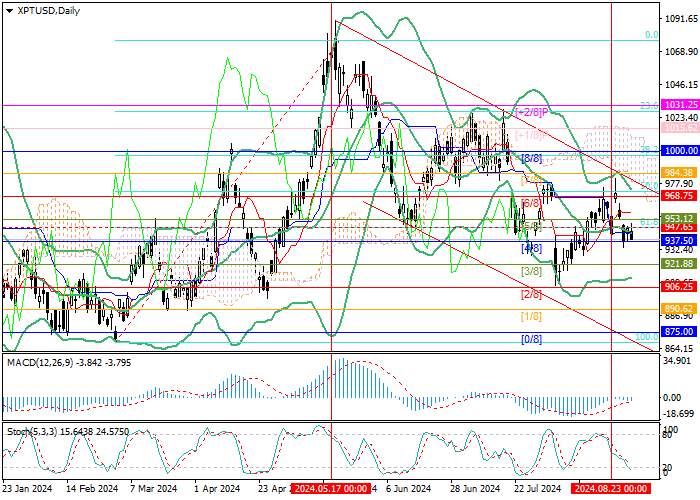
The XPT/USD pair is trading within a long-term downward channel: at the beginning of the week, the price reached monthly highs around 980.90, but then lost its previously gained positions and is now near the central line of Bollinger Bands (940.00).
The initial price increase was caused by comments by the head of the US Federal Reserve, Jerome Powell, at an Economic symposium in Jackson Hole, where the official stated the need to adjust monetary policy, since the risks of inflation are practically leveled, and the probability of a decrease in employment remains. The market took the rhetoric as a signal of the beginning of interest rate cuts in September, which caused the strengthening of assets alternative to the dollar, but currently the dynamics have weakened due to fears that the first change in parameters will become less significant than previously predicted. Preliminary data on the US gross domestic product (GDP) for the second quarter published yesterday recorded a 3.0% recovery in the American economy, which significantly exceeded both the forecast of 2.8% and the previous figure of 1.4%. In these circumstances, officials may well limit themselves to reducing the cost of borrowing by 25 basis points instead of 50 basis points. Nevertheless, the board members of the US Federal Reserve are likely to make a final decision after the publication of August unemployment data next week. If it stabilizes at current levels (4.3%), the reduction in the key rate is likely to be minimal, and in the case of an increase in the indicator, it will be more aggressive.
Support and resistance
Technically, the price is testing the central line of Bollinger Bands (940.00), consolidating below which and the level of 937.50 (Murrey level [4/8]) will strengthen the downward dynamics towards the targets of 906.25 (Murrey level [2/8]) and 890.62 (Murrey level [1/8]). The key for the "bulls" is the level of 968.75 (Murrey level [6/8], 50.0% Fibonacci retracement), at the breakout of which the price may leave the descending channel and continue to rise to 1000.00 (Murrey level [8/8], 38.2% Fibonacci retracement) and 1031.25 (Murrey level [ 2/8], 23.6% Fibonacci retracement).
Technical indicators do not give a clear signal: Bollinger Bands are horizontal, MACD has moved into the negative zone, and Stochastic is pointing down, but has approached the oversold zone.
Resistance levels: 968.75, 1000.00, 1031.25.
Support levels: 937.50, 906.25, 890.62.

Trading tips
Short positions should be opened below the level of 937.50 with targets of 906.25, 890.62 and a stop-loss around 962.00. Implementation period: 5–7 days.
Long positions can be opened above the 968.75 mark with targets of 1000.00, 1031.25 and a stop-loss in the area of 943.00.
Disclaimer: The views expressed are solely those of the author and do not represent the official position of Followme. Followme does not take responsibility for the accuracy, completeness, or reliability of the information provided and is not liable for any actions taken based on the content, unless explicitly stated in writing.


Leave Your Message Now