The shares of General Electric Co., an American diversified corporation, are trading at 166.00.
On the daily chart, the price is moving in a corrective trend, forming a Triangle pattern with narrowing boundaries of 173.00–153.00.
On the four-hour chart, the quotes are preparing to enter the last third of the pattern, where its implementation will begin. According to the pattern rules, a breakout of the resistance level 173.00 is more likely. In this case, the growth target will be the year’s high of 180.00.
Technical indicators have given a poor buy signal: fast EMA on the Alligator indicator have crossed the signal line upwards, preparing to start expanding the range, and the AO histogram is forming correction bars near the transition level.
Trading tips
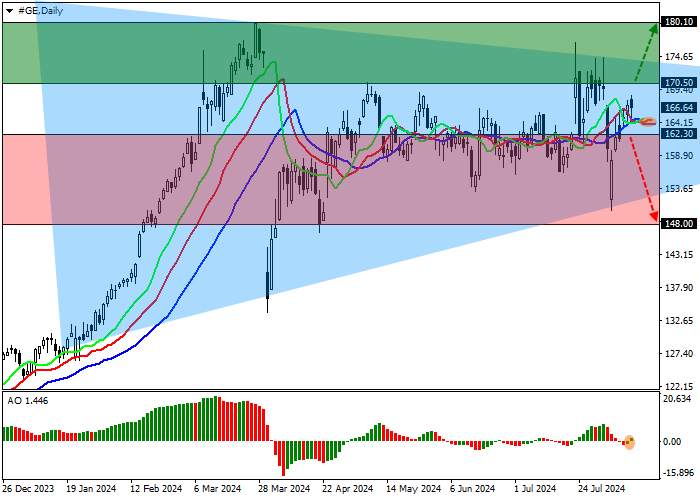
Long positions may be opened after the price rises and consolidates above 170.50, with the target at 180.10. Stop loss is 167.00. Implementation period: 7 days or more.
Short positions may be opened after the price falls and consolidates below 162.30, with the target at 148.00. Stop loss is 165.00.


Leave Your Message Now