© 2026 Followme
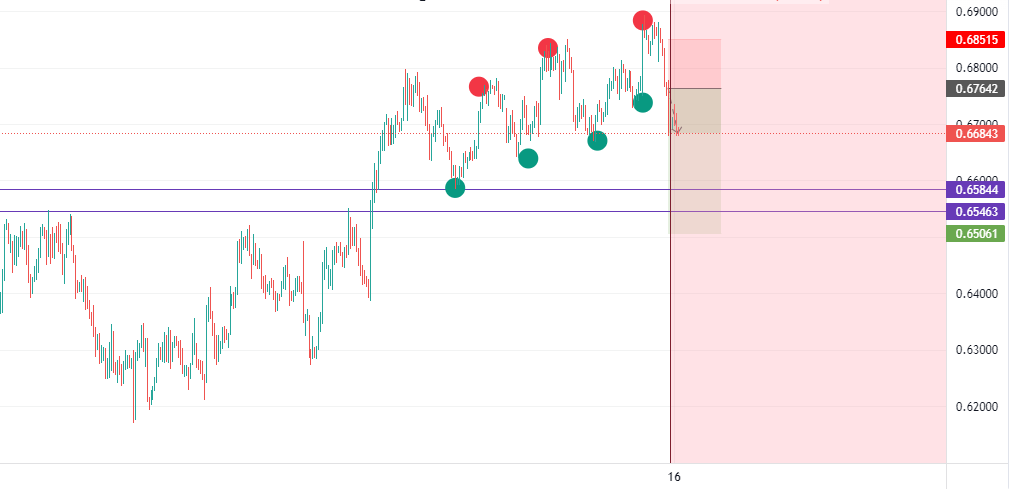
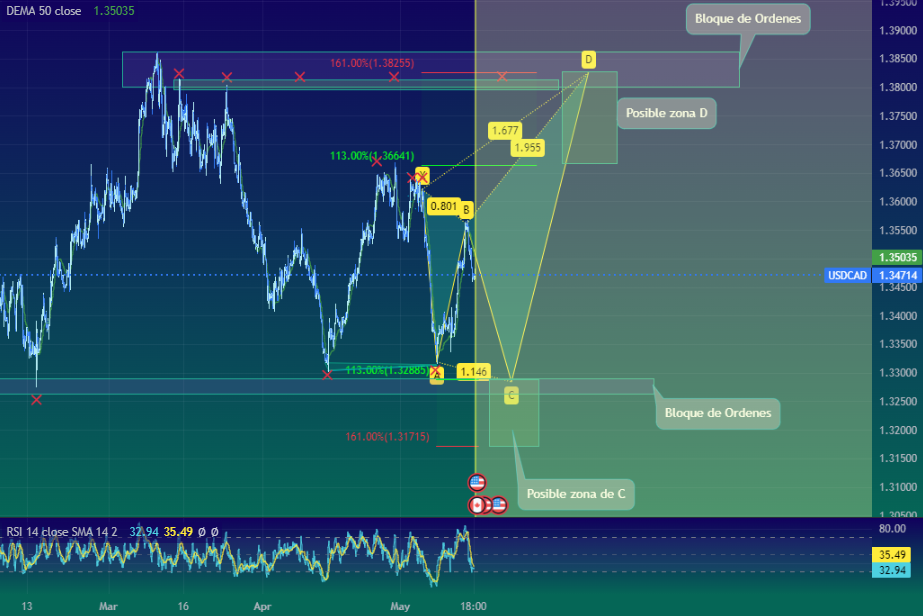
Possible Shark in H1 temporality
Here we see in USDCAD what is a Shark pattern in formation, projecting X-A and A-B. You can see what are possible zones of C and D following the fibo percentage plots that as a rule should comply if it turns out to be a Shark. Note that fibonacci retracements confluence with areas where there is exp
- Joseph abuchi :good morning dear
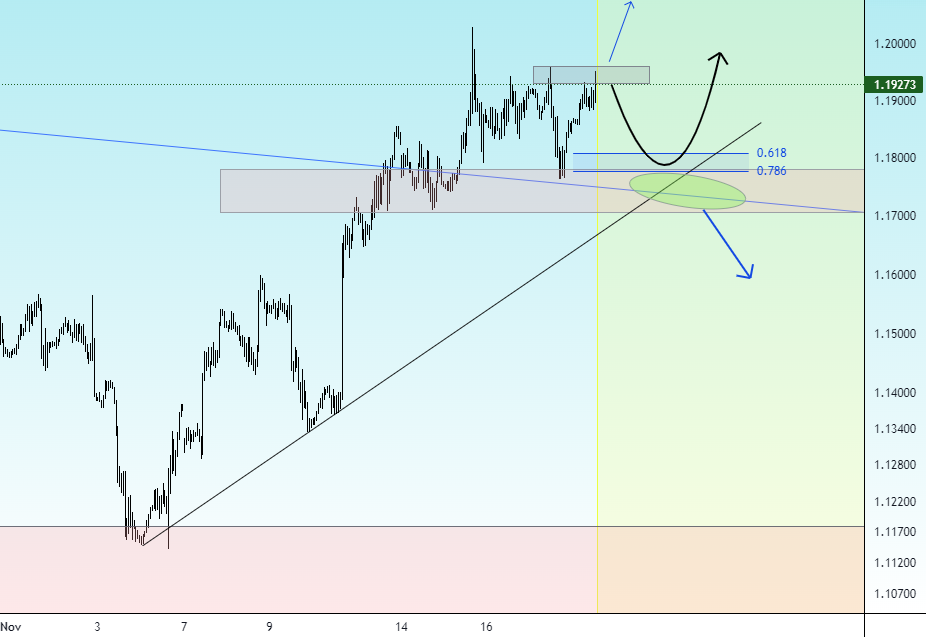
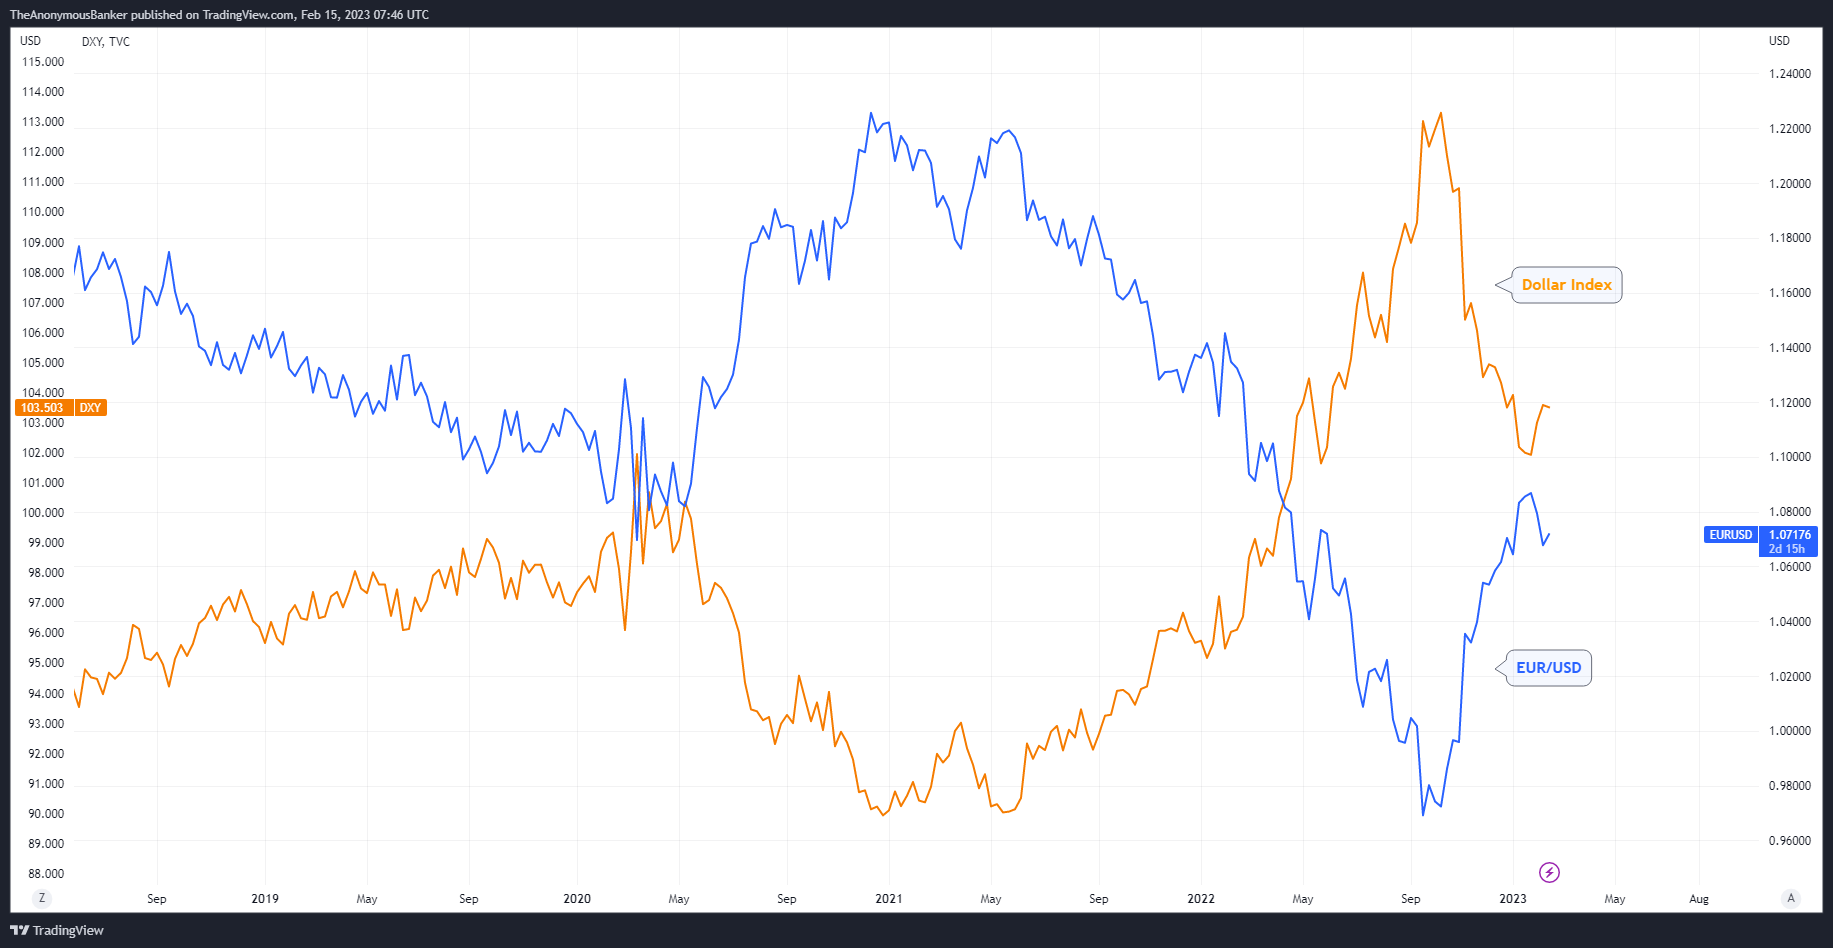
EURUSD: Mid Term Analysis after US Inflation
Today we look at the $EURUSD pair following the US inflation data released yesterday. First of all, I share this idea with you based on my analysis about the Dollar Index ( $DXY ) which you can see below, that said, we know that there is an inverse correlation between $EURUSD and $DXY, so if we have
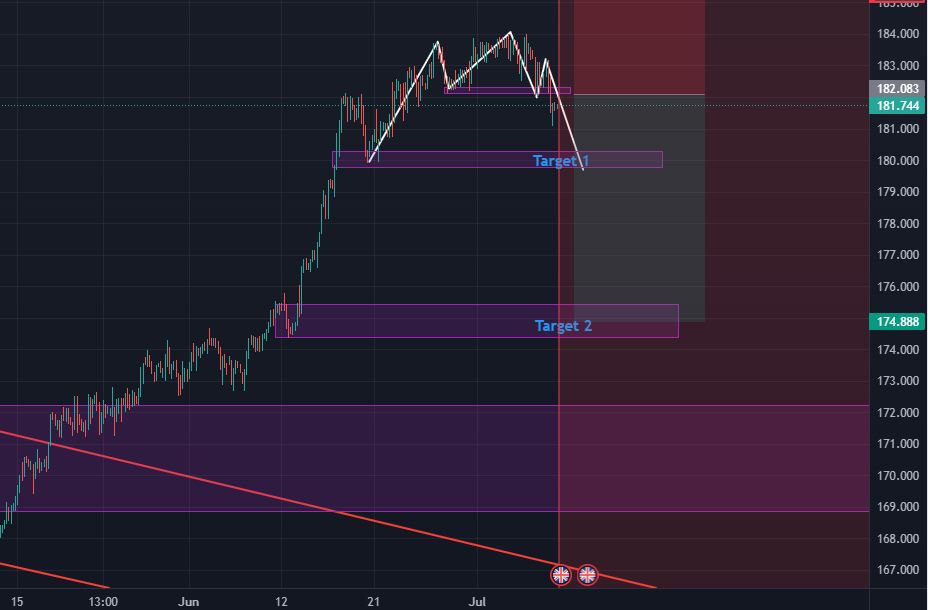
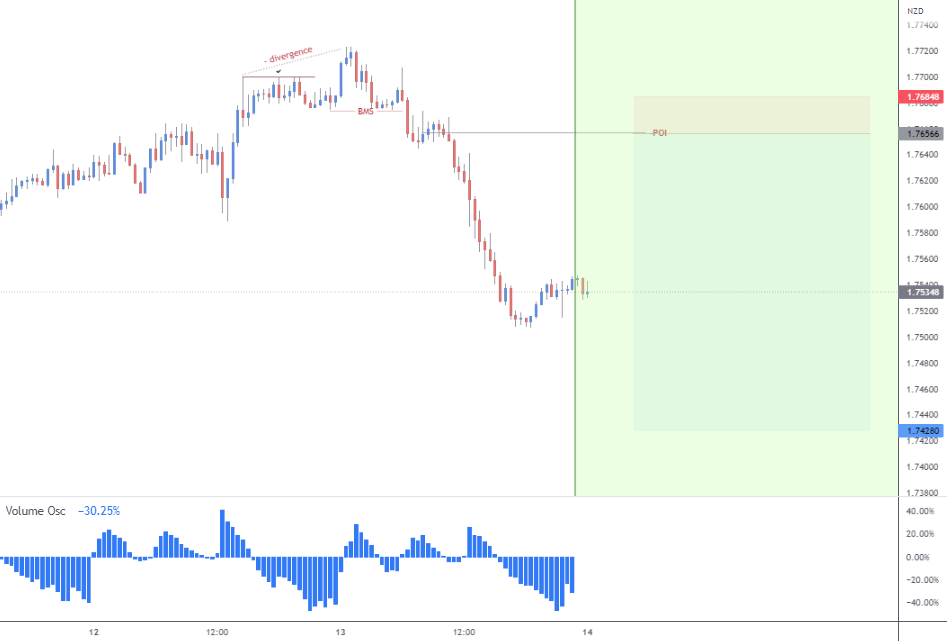
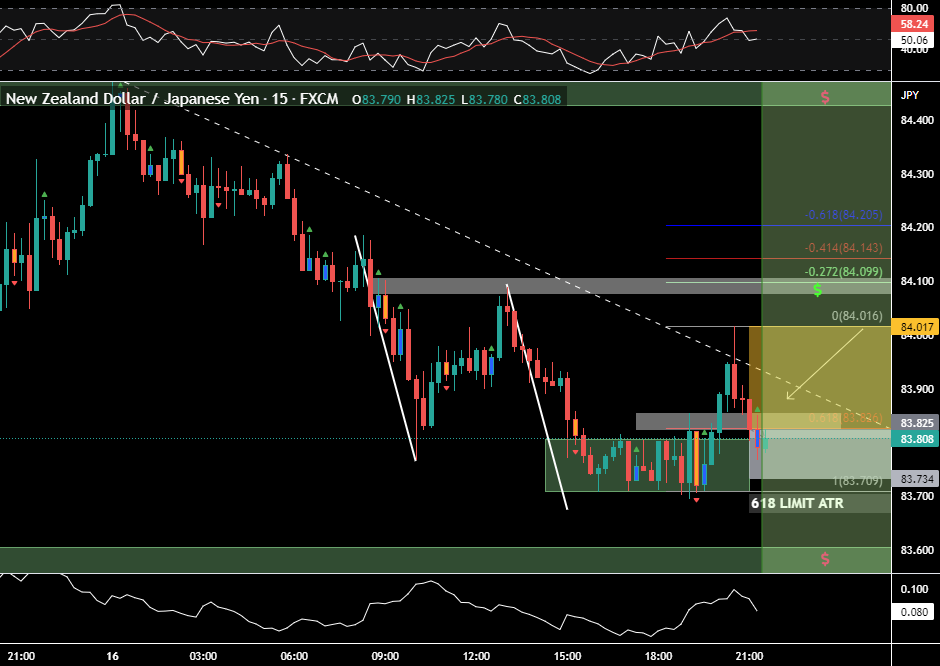
ASIA NJ 618 LIMIT ATR
NJ and AJ seem to be the last pairs to want to join JPYs downfall, this could either mean we can expect a pullback on all JPY pairs or that its simply late to the party and still gathering volume for a bigger push up.. not sure, but decided to test this hypothesis by entering a limit buy order at th
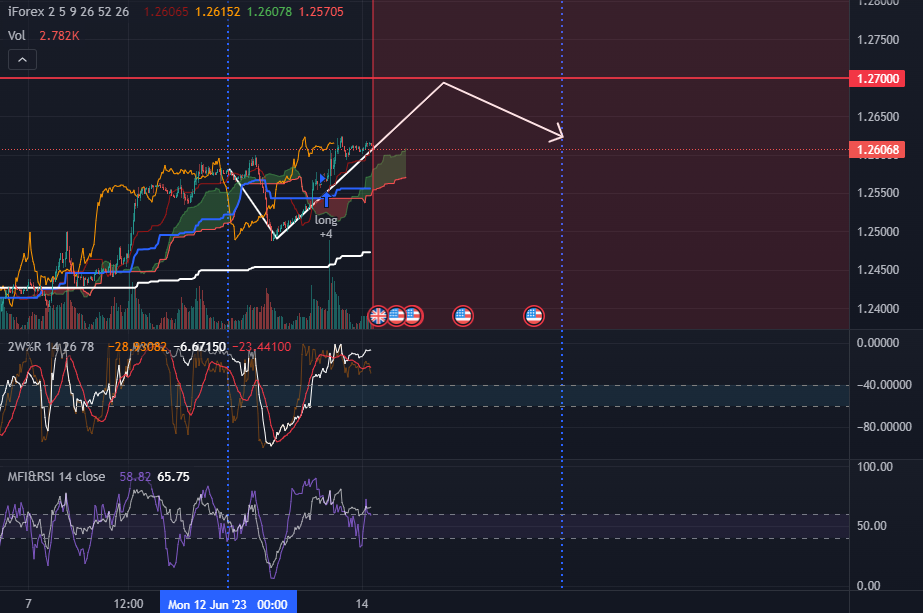
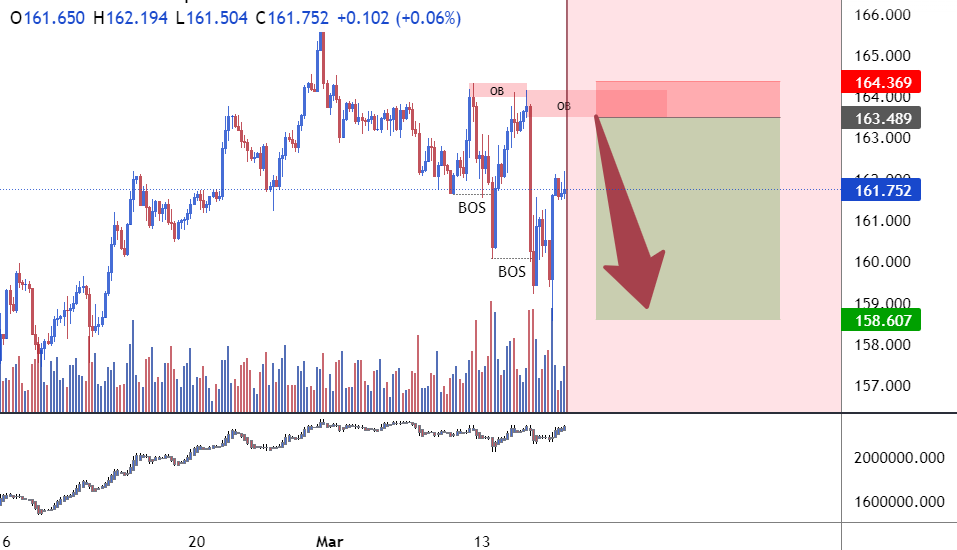
CADCHF - Perhaps another leg higher?
Checking higher timeframes at key support of weekly, monthly and daily we've got range breaking out, further upside could take us towards 0.70500 areas. However, keep in mind if we go back within this range I'd be re-thinking core long on CADCHF We had CPI came in as estimate, it wasn't a major move