
· Views 249
GOLD: DAILY CHART TECHNICAL ANALYSIS
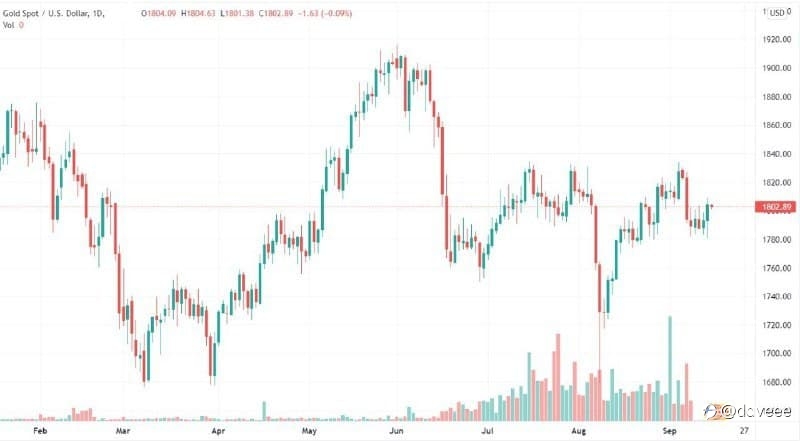
Regardless of colliding an instant trading range between $1,782 and $1,804, gold prices failed to provide a daily closing beyond the 200-DMA level near $1,809.
Also challenges the gold buyer is the slow MACD and RSI conditions, as well as double tops $1,834.
As of now, 61.8% Fibonacci retracement of July-August fall, around $1,777, adds to the downside filters, other than the multiple lows marked recently near $1,782.
It’s worth analyzing that five-week-old horizontal support of around $1,758 will challenge gold bears below $1,777.
In general, gold remains resistant but needs to cross the 200-DMA for giving controls to the bulls.
Disclaimer: The content above represents only the views of the author or guest. It does not represent any views or positions of FOLLOWME and does not mean that FOLLOWME agrees with its statement or description, nor does it constitute any investment advice. For all actions taken by visitors based on information provided by the FOLLOWME community, the community does not assume any form of liability unless otherwise expressly promised in writing.
FOLLOWME Trading Community Website: https://www.followme.com


Hot
No comment on record. Start new comment.