
· Views 297
--lower and higher time-frame Japanese Candle Stick correlation.
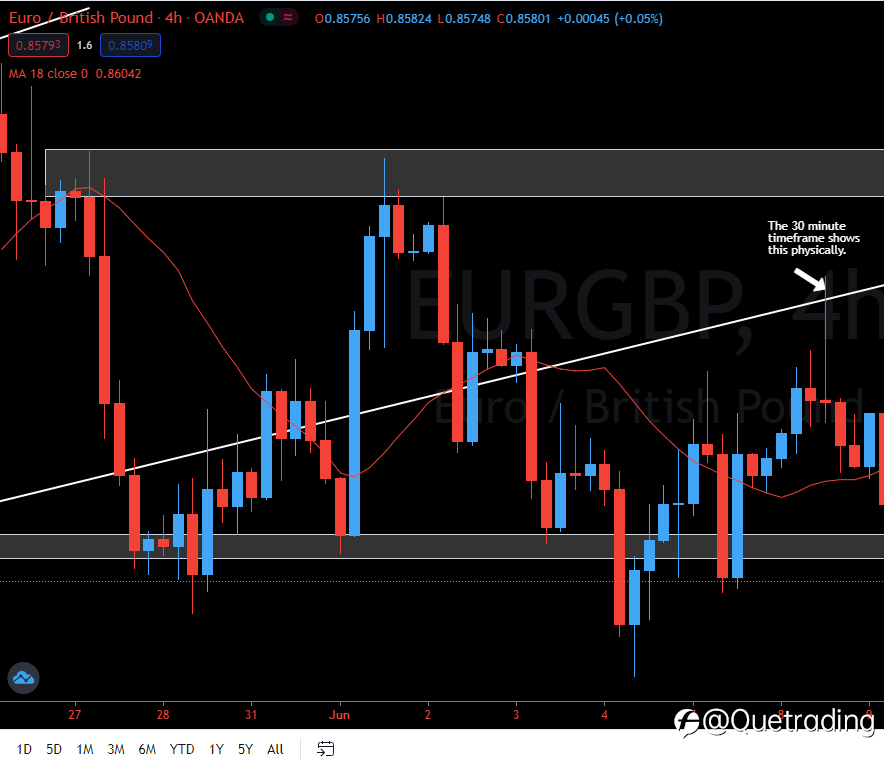
Here on the 4 hour we have price touching the top of an ascending channel and sellers pushed it to close with a very small body.
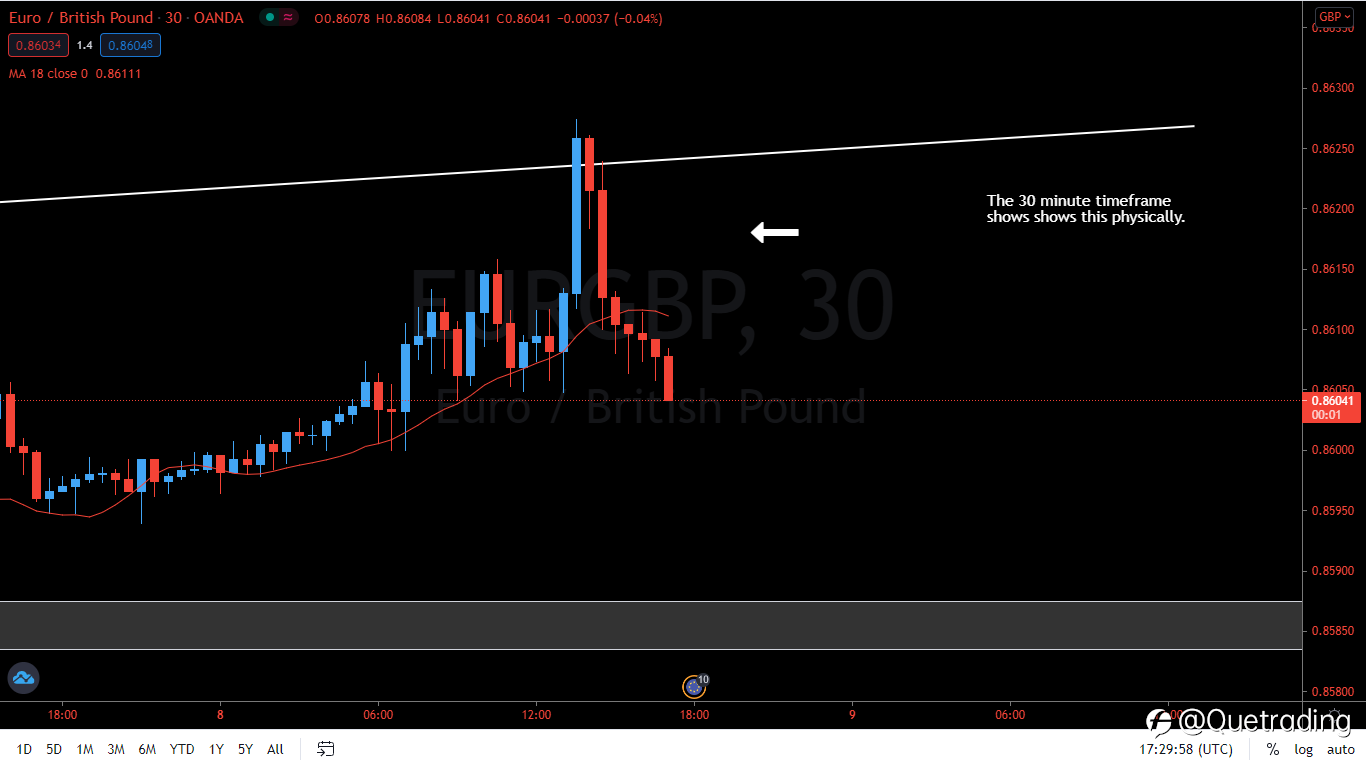
The 30 minute time frame shows this broke down in time increments of 30 minute's but in Japanese candle stick bars.
Some traders would have caught this, and road the first big bearish move on the 30 minute with other influencing factors.
--Been working on visuals on Psychology of correlating market structure and time frame with price action.
It will help those see things they might of not been able to recognize in the past or give you ideas on improving your ability to read price! Most importantly enhancing your view of the charts!
#OPINIONLEADER# #TradeNotes#
#forexmarket# #FX# #CurrencyPairs# #Tradeview# #Todayanalysis#
If you want to see more please leave a comment. Thanks for viewing!
Disclaimer: The content above represents only the views of the author or guest. It does not represent any views or positions of FOLLOWME and does not mean that FOLLOWME agrees with its statement or description, nor does it constitute any investment advice. For all actions taken by visitors based on information provided by the FOLLOWME community, the community does not assume any form of liability unless otherwise expressly promised in writing.
FOLLOWME Trading Community Website: https://www.followme.com


Hot
-THE END-