EUR/USD Price Analysis: Fades bounce off 10-day EMA below 1.0680 hurdle

- EUR/USD struggles near daily top, prints the biggest intraday gains in two weeks.
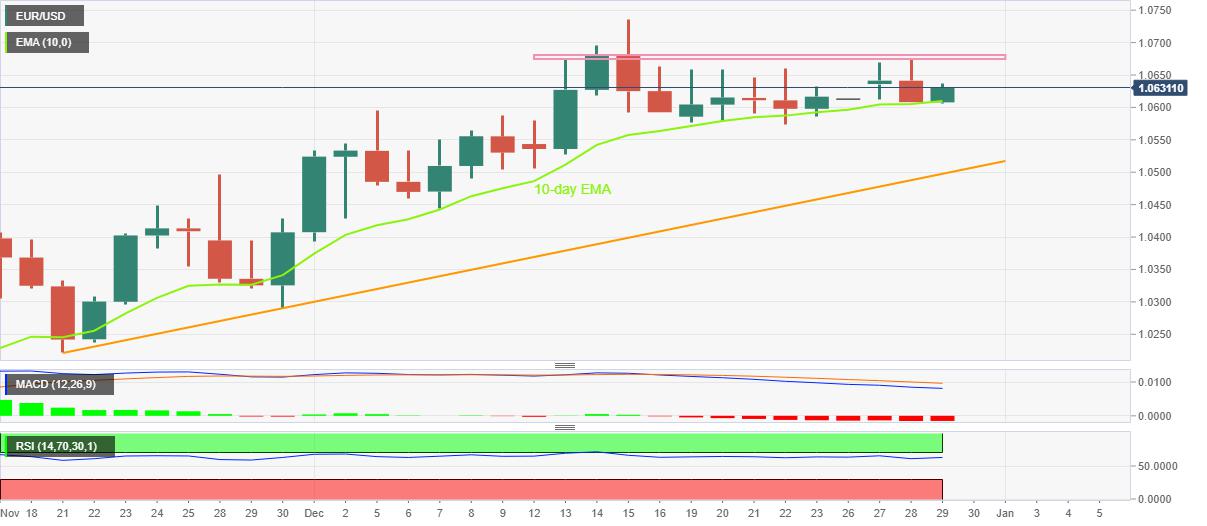
- Bearish MACD signals, nearly overbought RSI conditions challenge buyers.
- 12-day-old horizontal resistance probe immediate upside, ascending trend line from November 21 puts a floor under the price.
EUR/USD bulls step back as the quote reverses from the intraday high to 1.0630 during early Thursday. Even so, the major currency pair prints the biggest daily gains in two weeks by the press time, up 0.20% intraday at the latest.
It’s worth noting that the 10-day Exponential Moving Average (EMA) puts a floor under the EUR/USD prices to around 1.0610.
However, the bearish MACD signals and the nearly overbought conditions of the RSI (14) keep the pair sellers hopeful.
That said, the 1.0600 round figure and an upward-sloping support line from November 21, close to 1.0500 by the press time, challenge the EUR/USD declines past the 10-day EMA level surrounding 1.0610.
In a case where the EUR/USD remains bearish past 1.0500, the odds of witnessing a slump towards the late November swing low near 1.0290 can’t be ruled out.
On the flip side, a two-week-old horizontal resistance area surrounding 1.0675-80 restricts the short-term EUR/USD upside before directing the bulls toward the monthly peak of 1.0736. Should the quote remains firmer past 1.0736, May’s peak of 1.0786 will be in focus.
Overall, EUR/USD remains on the bear’s radar despite multiple bounces off the 10-day EMA.
EUR/USD: Daily chart
Trend: Pullback expected
Reprinted from FXStreet_id,the copyright all reserved by the original author.
Disclaimer: The content above represents only the views of the author or guest. It does not represent any views or positions of FOLLOWME and does not mean that FOLLOWME agrees with its statement or description, nor does it constitute any investment advice. For all actions taken by visitors based on information provided by the FOLLOWME community, the community does not assume any form of liability unless otherwise expressly promised in writing.
FOLLOWME Trading Community Website: https://www.followme.com


Hot
No comment on record. Start new comment.